
Figures & data
Table 1. Baseline characteristics of patients.
Figure 1. The impact of risk factors among patients without AKI, with nonoliguric and oliguric AKI. (*p value was calculated using the Chi-square test for categorical variables and the independent t-test for continuous variables.) A. The impact of preventive measure; B. The impact of the number of electrodes; C. The impact of red blood cell (RBC) level; D. The impact of hemoglobin (HGB) level; E. The impact of albumin (Alb) level.
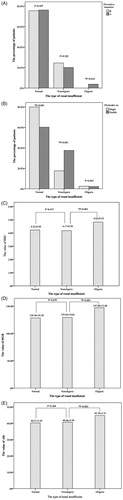
Table 2. The incidence and risk factors of AKI.
Table 3. The distribution of biochemical parameters after treatment, and their effects on the incidence of AKI.
Figure 2. The comparison of the values of RBC, HGB and WBC before and after treatment (*p value was calculated using the independent t-test. The value marked in the picture represents the change in levels before and after the treatment. A. The value of red blood cells (RBC); B. The value of hemoglobin (HGB); C. The value of white blood cells (WBC).
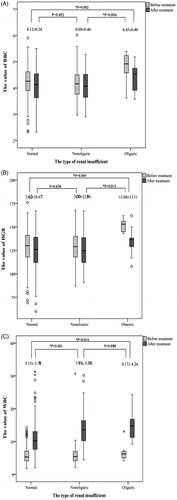
Figure 3. The comparison of Na+, K+ and Cl− in patients with different AKI type. (*p value was calculated using the independent t-test.) A. The value of Na+; B. The value of K+; C. The value of Cl−.
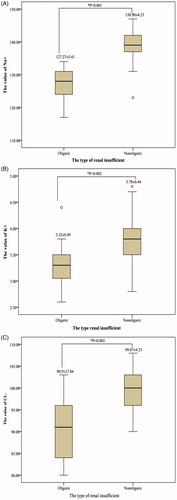
Table 4. Information on the duration of postoperative hospital stay.
Table 5. The comparison of biochemical parameters in AKI patients treated with and without preventive measures.