
Figures & data
Figure 1. Flow chart of patient selection.
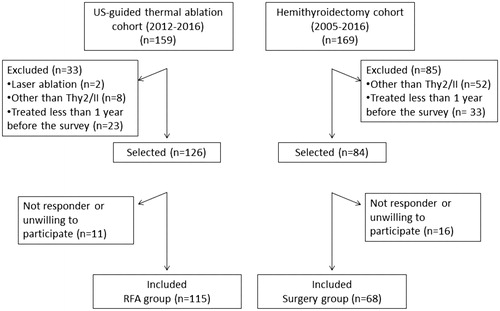
Table 1. Patients’ characteristics at baseline.
Table 2. Nodule volume reduction after RFA.
Figure 2. Survey outcome in all patients. Patients included 115 subjects treated with RFA and 68 subjects treated with surgery. (A) Pie charts representing the distribution of the answers ‘yes’, ‘partially’ and ‘no’ to the question: ‘Are you satisfied with the resolution of nodule-related symptoms?’. Upper panel: pie charts that include asymptomatic patients; lower panel: pie charts that exclude asymptomatic patients. (B) Pie charts representing the distribution of the answers ‘yes’, ‘partially’ and ‘no’ to the question: ‘Are you satisfied with the cosmetic results?’. (C) Pie charts representing the distribution of the answers ‘yes’, ‘partially’ and ‘no’ to the question: ‘Are you satisfied overall with the procedure?’.
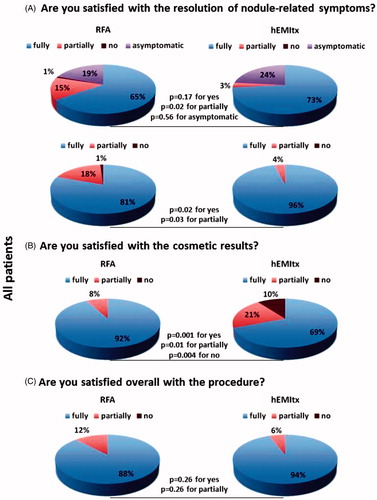
Figure 3. Survey outcome in the subgroup of patients with nonfunctioning thyroid nodules. Patients included 83 subjects treated with RFA and 44 subjects treated with surgery. (A) Pie charts representing the distribution of the answers ‘yes’, ‘partially’ and ‘no’ to the question: ‘Are you satisfied with the resolution of nodule-related symptoms?’. Upper panel: pie charts that include asymptomatic patients; lower panel: pie charts that exclude asymptomatic patients. (B) Pie charts representing the distribution of the answers ‘yes’, ‘partially’ and ‘no’ to the question: ‘Are you satisfied with the cosmetic results?’. (C) Pie charts representing the distribution of the answers ‘yes’, ‘partially’ and ‘no’ to the question: ‘Are you satisfied overall with the procedure?’.
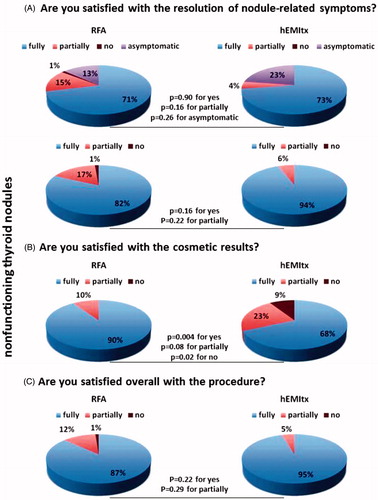
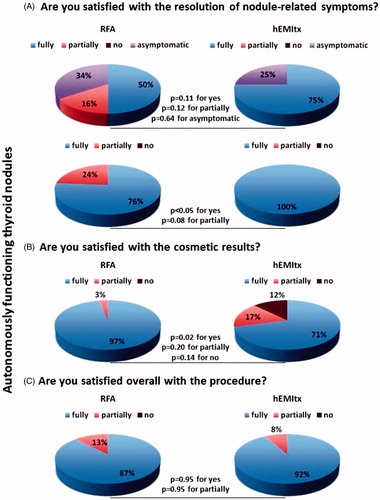
Figure 4. Survey outcome in the subgroup of patients with autonomously functioning thyroid nodules. Patients included 32 subjects treated with RFA and 24 subjects treated with surgery. (A) Pie charts representing the distribution of the answers ‘yes’, ‘partially’ and ‘no’ to the question: ‘Are you satisfied with the resolution of nodule-related symptoms?’. Upper panel: pie charts that include asymptomatic patients; lower panel: pie charts that exclude asymptomatic patients. (B) Pie charts representing the distribution of the answers ‘yes’, ‘partially’ and ‘no’ to the question: ‘Are you satisfied with the cosmetic results?’. (C) Pie charts representing the distribution of the answers ‘yes’, ‘partially’ and ‘no’ to the question: ‘Are you satisfied overall with the procedure?’.
Supplemental Material
Download MS Power Point (178.6 KB)Supplemental Material
Download PDF (94.1 KB)Supplemental File 1
Download PDF (99.8 KB)Data availability statement
The datasets generated during and/or analyzed during the current study are available from the corresponding author on reasonable request.