Figures & data
Figure 1. Schematics of the experimental setup: (a) the integrated DRS system and experiment setup for measuring the local optical properties and temperature of porcine liver tissues during heating; (b) the self-calibration channel and (c) the EFPI temperature sensor.
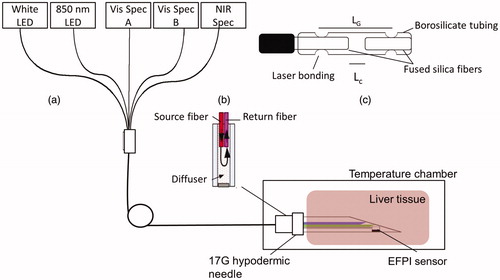
Figure 2. The measured vs. expected (a) µa and (b) µs′ of the tissue mimicking phantoms.
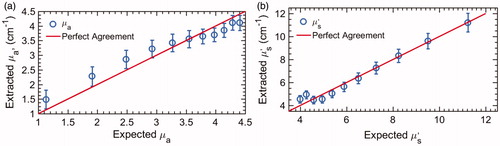
Figure 3. The mean tissue temperature vs. time during heating of ex vivo porcine liver samples.
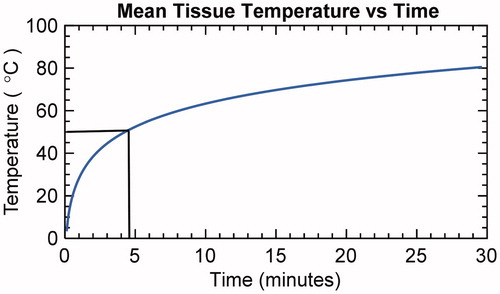
Figure 4. Absolute change in the liver tissue (a) µa and (b) µs′ and relative change in (c) µa and (d) µs′ (n = 10).
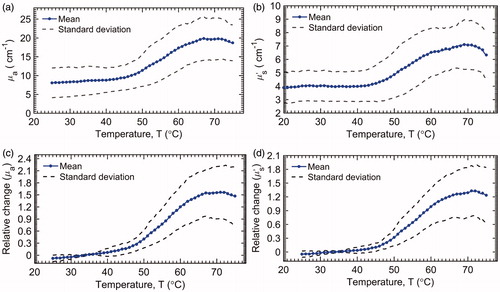
Figure 5. Absolute changes in (a) µa and (b) µs′ at selected wavelengths during tissue heating.
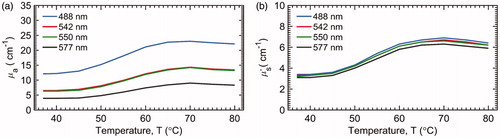
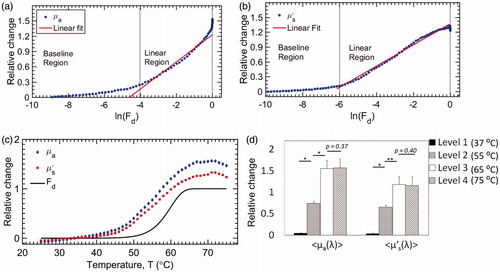
Figure 6. Relative changes in (a) µa and (b) µs′ compared with the natural logarithm of Fd; (c) continuous measurement of relative changes in µa and µs′, and Fd at different temperatures; (d) comparison of relative changes in µa and µs′ at Level 1 (37 °C), 2 (55 °C), 3 (65 °C) and 4 (75 °C), respectively. For both parameters, levels 1, 2 & 3 were significantly different from each other. Levels 3 & 4 were not statistically different from each other. (* indicates p < .0003 and ** indicates p < .001).