
Figures & data
Table 1. Clinical characteristics of primary breast cancer and liver metastasis.
Figure 1. Overall survival curves in breast cancer liver metastasis patients after RFA and diagnosis of liver metastasis. From the time of the first RFA, median overall survival time and one-, two-, three- and five-year survival rates were 26 months and 81.8, 50.1, 25.3 and 11.0%, respectively. From the time the liver metastasis was diagnosed, the median overall survival time was 36 months and the one-, two-, three- and five-year survival rates were 92.6, 75.2, 48.7 and 20.7%, respectively (p = .004).
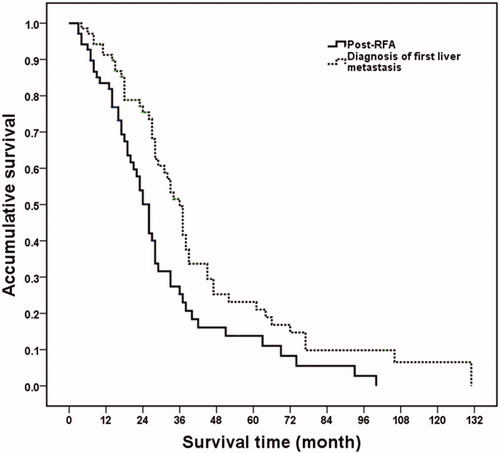
Figure 2. Post-RFA overall survival curves in breast cancer liver metastasis patients with different maximum diameter of metastasis lesions. Patients with maximum diameter of metastasis ≤3 cm had higher overall survival rate than those patients with 3.1–6 cm lesions (p = .003).
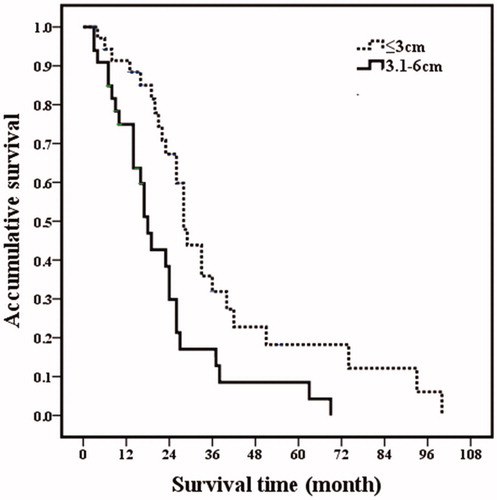
Figure 3. Post-RFA overall survival curves in breast cancer liver metastasis patients with different number of metastasis. Patients with 1–2 metastases had higher overall survival rates than those patients with 3–5 metastases (p = .030).
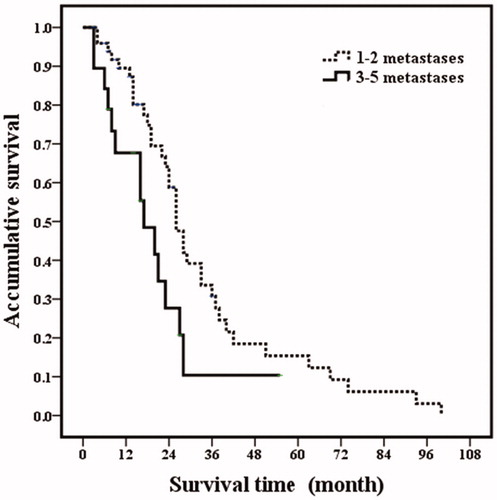
Figure 4. Post-RFA overall survival curves in breast cancer liver metastasis patients with extrahepatic metastatic disease. Patients with extrahepatic metastatic disease had poor overall survival rates than those patients without extrahepatic metastatic disease (p = .001).
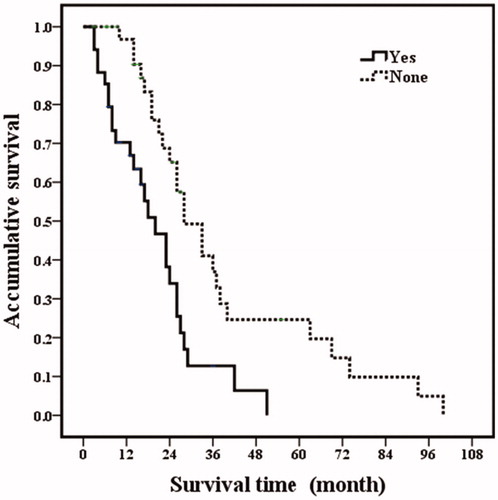
Figure 5. Overall survival curves in breast cancer liver metastasis patients with estrogen receptor status. Patients with estrogen receptor negative had poorer overall prognosis (p <.001).
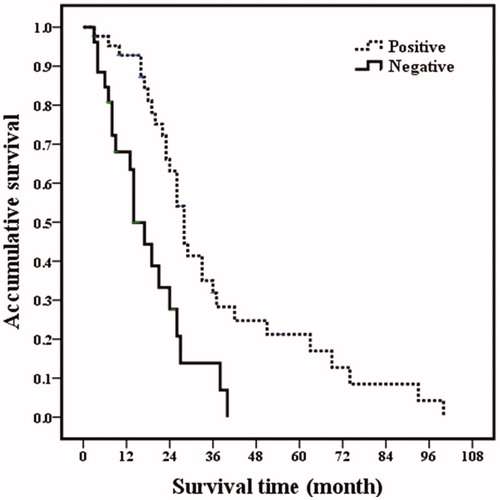
Figure 6. A 54-year-old woman with breast cancer liver metastasis (BCLM) underwent radiofrequency ablation (RFA) treatment. (A) Ultrasound before RFA showed a 3.1 cm tumor in segment II of liver (↑). The tumor was diagnosed as BCLM-moderately differentiated adenocarcinoma by ultrasound-guided biopsy. (B) Contrast-enhanced CT before RFA showed a 3.1 cm tumor in segment II of liver. (C) Ultrasound in 53 months after first RFA showed the second RFA was performed for the new liver metastasis in segment III. (D) Contrast-enhanced CT in one month after RFA showed that ablation zone had non-enhancing. (E) Ultrasound in 80 months after first RFA showed multiple new intrahepatic metastases (↑). The patients underwent chemotherapy. (F) Magnetic resonance imaging (MRI) in 80 months after first RFA confirmed that ablation area had non-enhancing (↑). (G) Ultrasound in 92 months after first RFA showed massive pleural effusion. (H) MRI in 95 months showed the ablation zone had non-enhancing but other liver metastasis had no response to chemotherapy treatment. This patient survived more than eight years post treatment and died due to the disease progression.
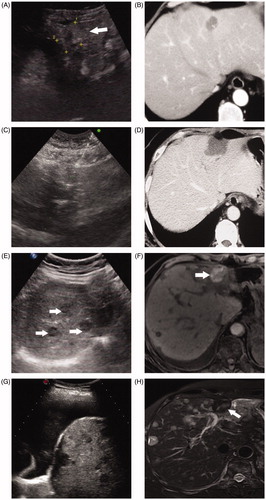
Table 2. Univariate analysis for BCLM overall survival prognosis after RFA.
Table 3. Multivariate analysis of overall survival prognostic factors with Cox proportional hazards in BCLM patients after RFA.
Figure 7. Kaplan-Meier curves for PFS of margin size after radiofrequency ablation. the one-, two-, three- and five-year PFS for margin of 0–5 , 6–10 and >10 mm were 54.2, 23.7 and 5.9%; 72.9, 44.8, 12.8 and 4.3% and 95.5, 65.8, 35.4 and 17.7%, respectively.
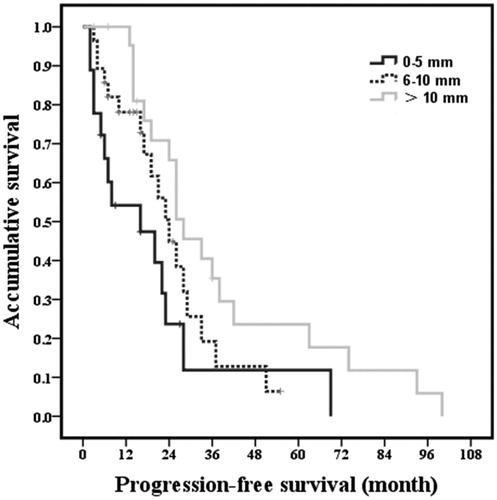
Table 4. Multivariate analysis of PFS with Cox proportional hazards in BCLM patients.