
Figures & data
Figure 1. Microwave ablation (MWA) procedure under ultrasound (US) guidance (A 18-year-old woman with a right breast fibroadenoma of 2.5 × 1.3 × 1.5 cm in size). (A) US guidance showed the accurate placement of the antenna tip in the tumour at the beginning of MWA session; (B, C) Hydro-dissection technique: PTC needle (yellow arrows) was firstly inserted into the interval between tumour margin and adjacent tissues to infusion of saline. Then MW antenna (red arrow) was inserted into the tumour for ablation; (D–F) Pull-back technique: antenna tip was firstly inserted into the deepest site of tumour for ablation (red arrow in D). Then pull back till the bottom section was completely ablated. After that, antenna tip was again inserted to ablate the centre section (red arrow in E). And again, antenna tip was inserted to ablate the top section (red arrow in F). Repeatedly, the ablated zone was through dots, lines, planes, and solids till to completely cover the entire tumors.
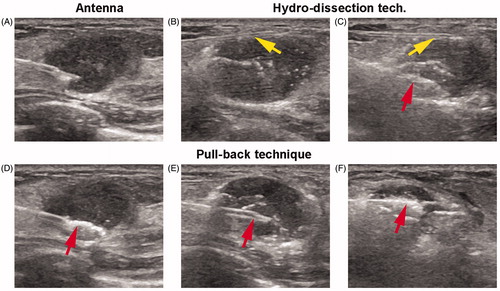
Table 1. Patients characteristics.
Figure 2. Technical success of MWA in one representative case (A 38-year-old woman with a left breast fibroadenoma of 1.2 × 1.1 × 1.0 cm in size). (A) US before MWA showed a hypoechoic tumour with clear boundary; (B) CEUS showed heterogeneous enhancement in the tumour; (C) CEMR showed the tumour (red arrow) was significant enhancement in arterial phase; (D) US showed the heterogeneous hypoecho in the ablated mass after MWA; (E) the ablated mass without enhancement on CEUS; (F) the ablated mass without enhancement on CEMR in arterial phase; (G–L) US variance of the breast benign tumour after MWA during follow up at 1, 3, 6, 12, 18, 24 months, respectively. Tumor size decreased gradually during the process and disappeared on the US image at the end; (M) no nodules were detected on CEMR at the follow-up of 24 month.
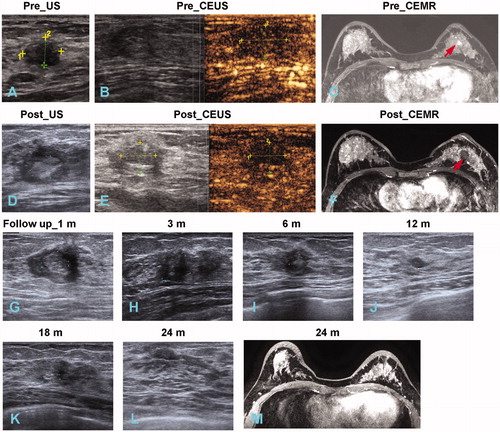
Table 2. Therapeutic response and clinical outcomes.
Figure 3. Mass volume evaluation during follow-up. (A) Mass volumes of 107 tumours in 56 patients with follow-up of 12 months. (B) Mass volumes of 83 tumours in 44 patients with follow-up of 18 months. (C) Mass volumes of 55 tumours in 26 patients with follow-up of 24 months. Baseline in (A–C) meant the time of MWA procedure. ***p < .001 by Mann–Whitney U test. (D) mean VRRs detection at the follow-up of 12, 18 and 24 months. ****p < .0001 by unpaired two-tailed t test. Data expression with mean ± SD or median (interquartile range), according to normality results.
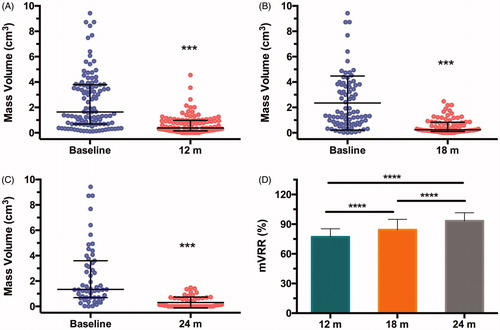
Figure 4. Mass volume evaluation in different sizes of tumours during follow-up of 24 months. (A, C, E) Mass volumes of 20 tumors ≥2 cm (A), 30 tumors of 1–2 cm (C), 5 tumors of ≤1 cm (E) in diameter (D). Baselines meant the time of MWA procedure. (B, D) volume reduction ratios (VRR) of tumours in different sizes of D ≥ 2 cm (A), 1 cm < D < 2 cm (C) at 18- and 24-month follow-ups, respectively. (F, G) VRRs comparison of tumours at different sizes at 18-month (F) and 24-month (G) follow-ups. *p < .05, ***p < .001 by unpaired two-tailed t test. Data expression with mean ± SD or median (interquartile range), according to normality results.
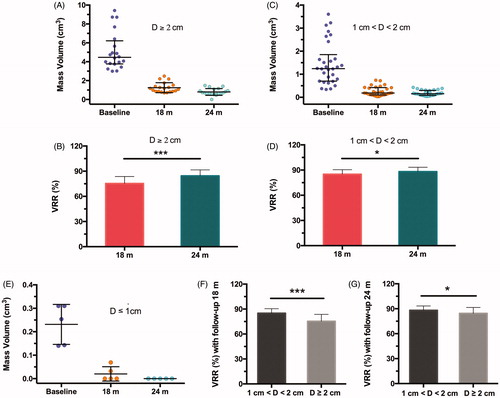
Figure 5. Palpability outcomes during the follow-up. (A) Variance trends of palpable masses. ***p < .001 by χ2 test. (B–D) Number of impalpable masses by physical examination in different sizes of tumors at follow-up of 3, 6, 12, 18 and 24 months, respectively.
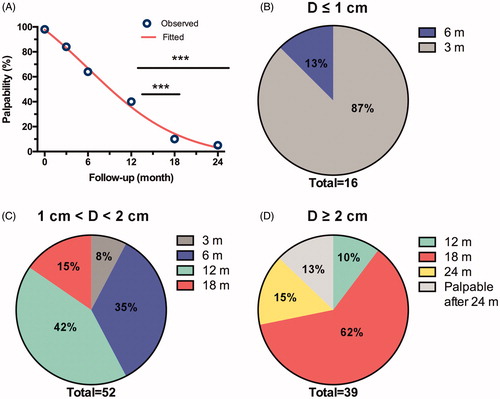
Table 3. Palpability outcomes during follow-up.