Figures & data
Figure 1. Patients enrolled in the study.
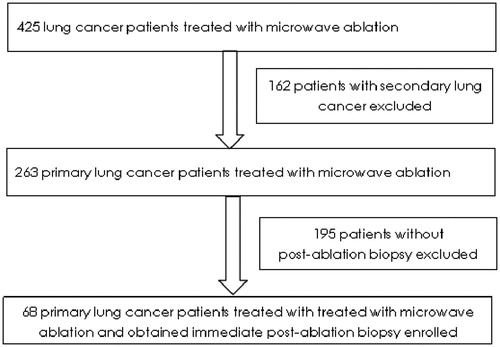
Table 1. Baseline characteristics of 68 enrolled patients.
Table 2. Baseline characteristics of four groups.
Figure 2. Pathology changes in the four groups. Group A: A1 (adenocarcinoma before MWA), A2 (MWA followed by immediate biopsy), A3 (adenocarcinoma after MWA); Group B: B1 (adenocarcinoma before MWA), B2 (MWA followed by immediate biopsy), B3 (adenocarcinoma after MWA, with burning degeneration). Group C: C1 (squamous cell carcinoma before MWA), C2 (MWA followed by immediate biopsy), C3 (definite cancer cells, no definite histology type); Group D: D1 (squamous cell carcinoma before MWA), D2 (MWA followed by immediate biopsy), D3 (no definite cancer cell).
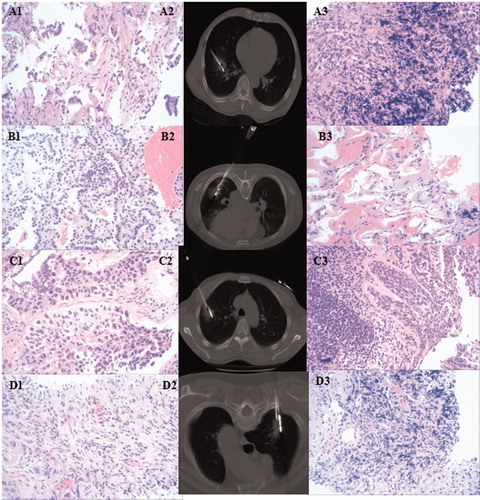
Table 3. Survival between the groups.
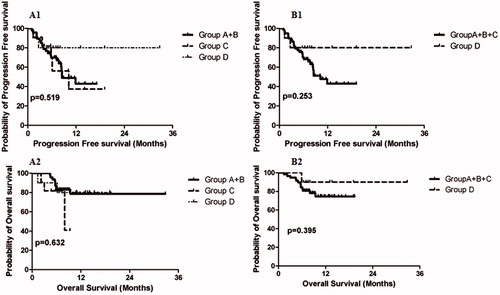
Figure 3. The Kaplan–Mirer curve of survival among groups. A: Group A + B versus Group C versus Group D: A1: PFS; A2: OS. B: Group A + B + C versus Group D: B1: PFS; B2: OS.