Figures & data
Table 1. Characteristics and limitations of hyperthermia QA methods.
Table 2. Focus diameters as measured with the Schottky Diode E-field sheet in several Pyrexar applicators.
Figure 1. Cross-section of the phantom (grey central circle) in the applicator. The dipole antennas are purple; the green cylinders are the reference tubes filled with fat-like material that is used for B0 drift correction. The black plane is the MRI field of view. Red dots are the steering targets and the white circles represent the corresponding idealised 50% heating contours. These steering settings are representative since, in clinical practice, heating targets are generally centrally located.
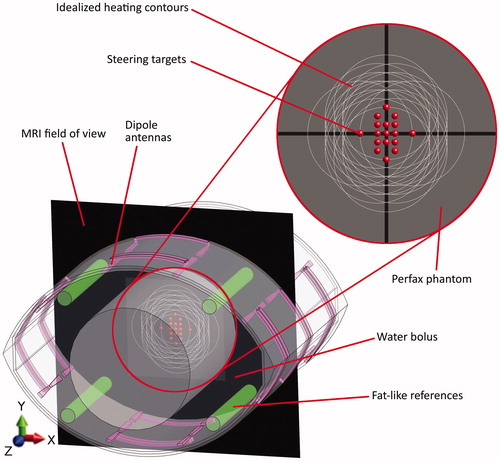
Figure 2. The stability of the dielectric properties of the Perfax phantom over the duration of an experiment.
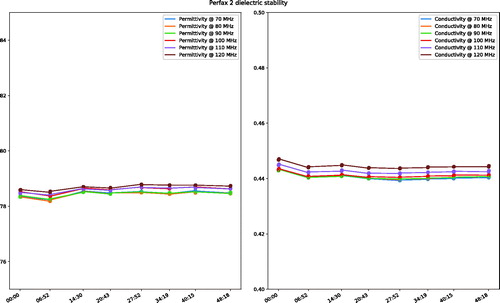
Figure 3. Perfax phantom on the wooden stands in the BSD2000–3D MR-compatible applicator in front of the MR scanner (left top) and axial (right top), transversal (left bottom) and coronal (right bottom) cross-sections through the measured temperature distribution in the Perfax phantom with (0,0) steering settings.
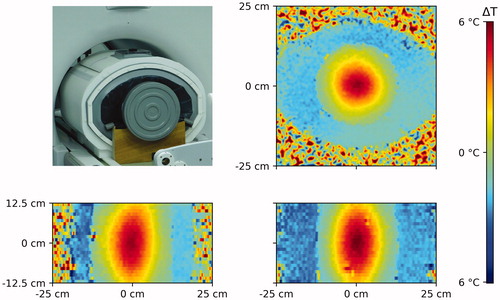
Figure 4. The linearity of the temperature increase during an experiment, indicating thermal conduction was negligible despite the 12.4 min heating duration.
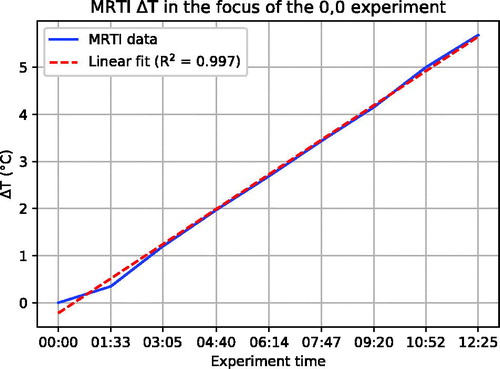
Figure 5. Distribution of temperature increase through the focus centre. 0.0 cm on the horizontal axis is the focus centre as measured with MRTI (). For clarity, only the central and extreme steering positions are plotted.
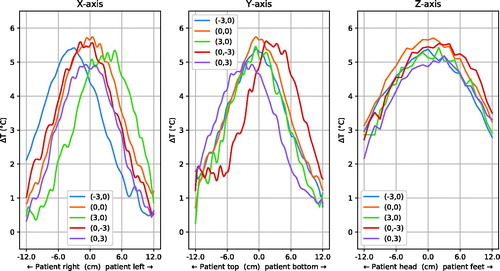
Figure 6. Left: heating targets as set on the Pyrexar console (dots) compared to the measured targets (stars) in the central axial plane. Right: overview of the location of the different target settings (red dots) in the Perfax phantom.
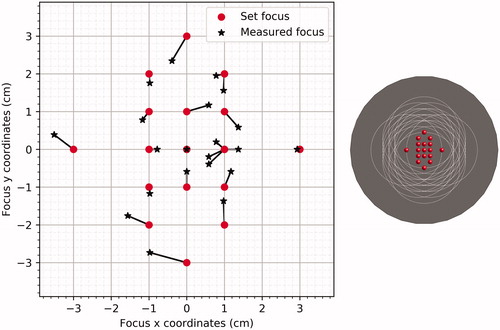
Figure 7. Distribution of absolute temperature increase asymmetry through the focus centre. 0.0 cm on the horizontal axis is the focus centre as measured with MRTI (). The plot lines stop at the phantom border, hence their lengths are unequal. For clarity, only the central and extreme steering positions are plotted.
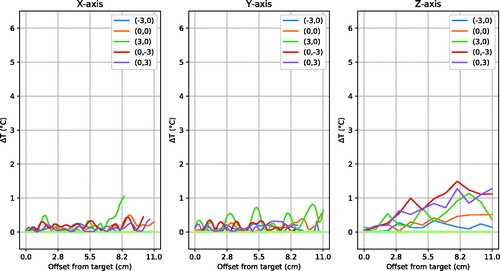
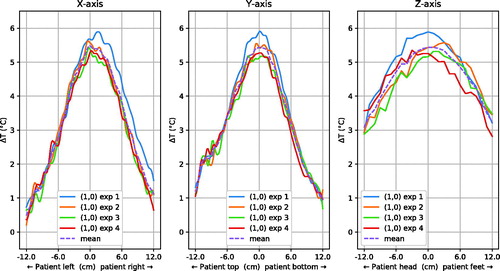
Figure 8. Distribution of temperature increase through the focus centre when steering to (1,0). 0.0 cm on the horizontal axis is the focus centre as measured with MRTI ().