Figures & data
Table 1. Values of the electrical and thermal tissue properties at 70 MHz used in the simulations.
Figure 1. The different steps of the analysis to determine linear correlations between measured changes in temperature and simulated changes in SAR or temperature after phase-amplitude steering.
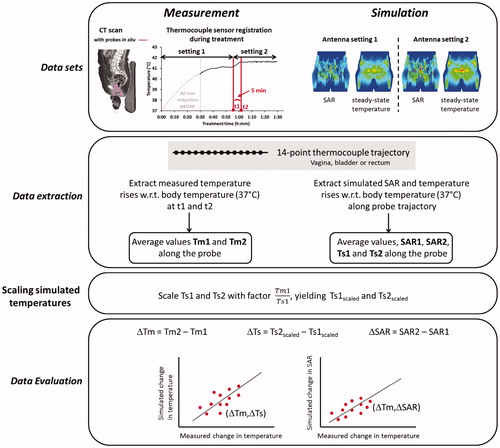
Figure 2. Flow chart of the event selection process, representing the excluded treatment sessions, events, and measurements. Note that multiple events can occur in one treatment session and that measurements were evaluated for each individual event.
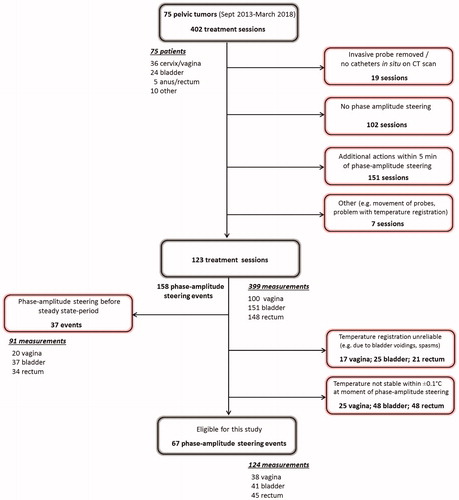
Table 2. Summary of the numbers finally included in the analysis.
Table 3. Median, minimum and maximum values of the measured temperature and (unscaled) simulated temperature and SAR, averaged over the thermocouple probe trajectory per location. Values were taken at the time of the phase-amplitude steering event. The last column indicates the total amount of power.
Figure 3. Correlation between measured changes in temperature and simulated changes in SAR after phase-amplitude steering for the vagina, bladder, and rectum, as well as for the vagina and rectum together.
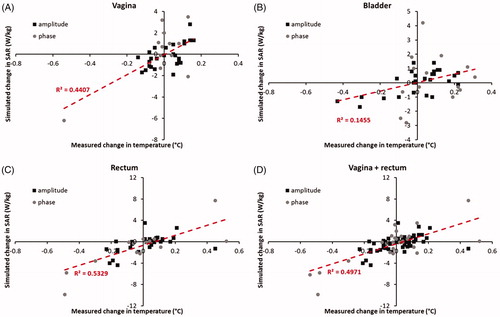
Figure 4. Correlation between measured and simulated changes in temperature after phase-amplitude steering for the vagina, bladder, and rectum, as well as for the vagina and rectum together. The shaded green region indicates the region where simulated and measured differences correspond within ±0.1 °C.
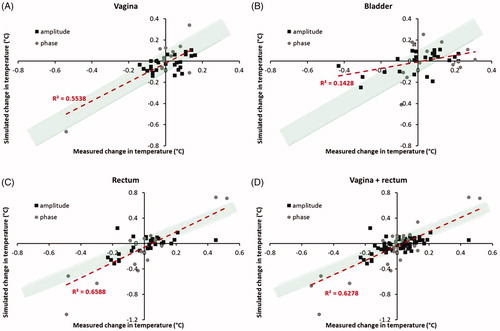
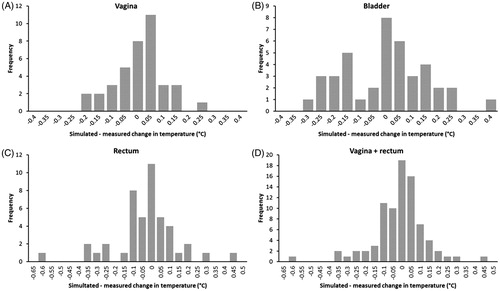
Figure 5. Histograms of the deviations between simulated and measured changes in temperature after phase-amplitude steering for the vagina, bladder, and rectum, as well as for the vagina and rectum together.