Figures & data
Figure 1. Flowchart of patients through the study.
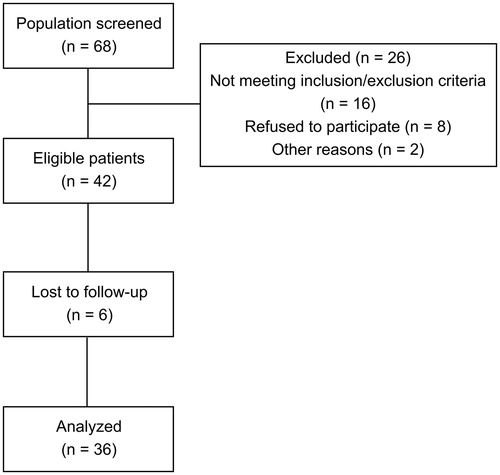
Table 1. Anthropometric and demographic data.
Table 2. Clinical measurements and serum concentration of inflammatory cytokines IL-8 and TGF-β in patients with OA before (pretreatment) and after (posttreatment) mud therapy intervention.
Figure 2. Correlation between serum inflammatory cytokine concentrations and clinical outcomes in patients with OA after the cycle of mud therapy: IL-8 and perceived pain (A) and TGF-β and knee flexion angle (°) (B). VAS: visual analog scale.
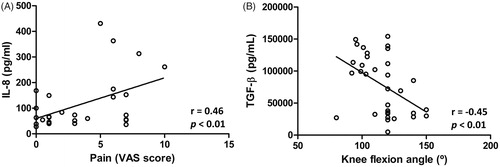
Figure 3. Percentage of CD4+ CD25+ FOXP3+ Treg cells (A) and CD8+ CD28– Treg cells (B) in patients with OA before (pre-treatment) and after (post-treatment) the cycle of mud therapy. Columns represent the mean ± SEM of independent assays performed in duplicate for each participant. **p < .01, ***p < .001 with respect to basal values.
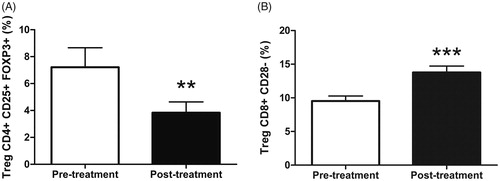
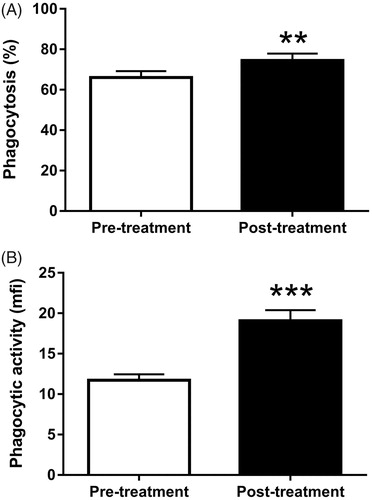
Figure 4. Functional capacity of circulating neutrophils in patients with OA before (pretreatment) and after (posttreatment) the cycle of mud therapy: percentage of ‘phagocytic neutrophils’ (A) and phagocytic activity of circulating neutrophils (B). Columns represent the mean ± SEM of independent assays performed in duplicate for each participant. **p < .01; ***p < .001 with respect to basal values.