Figures & data
Figure 1 (A and B) US-guided FNA of a pathologic lymph-node, right level VI, 12 × 7×7 mm (white arrow). Cytologic diagnosis: lymph-node metastasis from medullary carcinoma. Calcitonin measurement on needle wash-out: 1278 pg/mL. (C and D) 18F-DOPA PET CT images (July 2016): pathologic adenopathy (7 × 6 mm) in the right upper thoracic passage (white arrows).
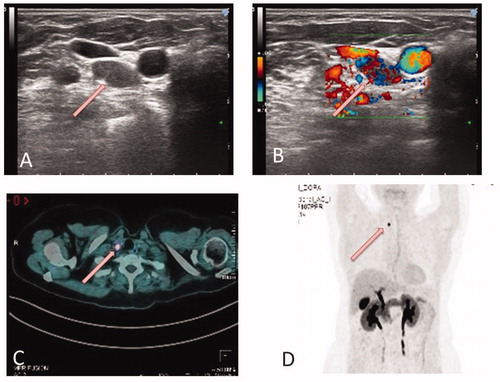
Figure 2. Neck Ultrasound Examination during treatment. Ultrasound-guided percutaneous laser ablation of the pathologic lymph-node showed in Figure 1. (A) the US image demonstrates the insertion of the optical fibre in the pathologic lymph-node (white arrow). (B) colour Doppler monitoring of the target lesion during US-guided laser treatment (white arrow).
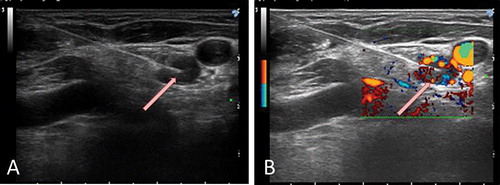
Figure 3. Neck ultrasound follow-up after LA. (A, B, C) Progressive volume decrease of the LA-treated lesion (A: at baseline; B. at 5 months; C: at 12 months). (D, E, F) Color-Doppler examination showed the marked decrease and, successively, the disappearance of the vascular signals within the treated area (D: at baseline; E: at 5 months; F: at 12 months). In all images, the arrows point toward the pathologic lymph-node.
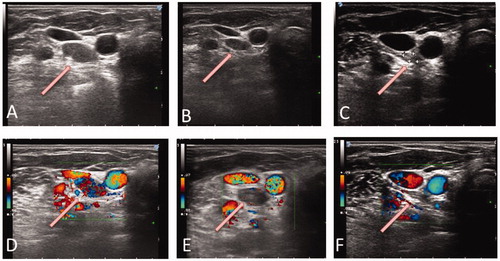
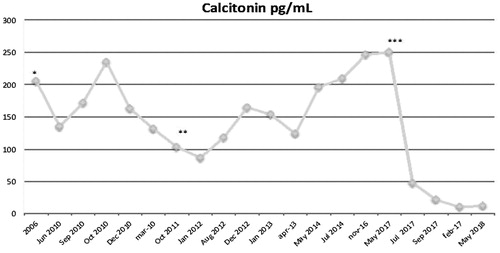
Figure 4. Calcitonin levels before and after surgery and thermal ablation treatment. * Thyroidectomy; ** Bilateral cervical dissection; *** Percuneous Laser Ablation.