Figures & data
Figure 1. (a) Small HCC node in the liver dome at baseline MDCT evident as focal contrast enhancement (red arrow). (b) US fusion with contrast enhanced CBCT: HCC node is barely detectable with US alone but this visualisation improves due to fused CBCT node visualisation (red arrow). (c) the subsequent needle-antenna deployment and ablation. d-1 month MDCT control.
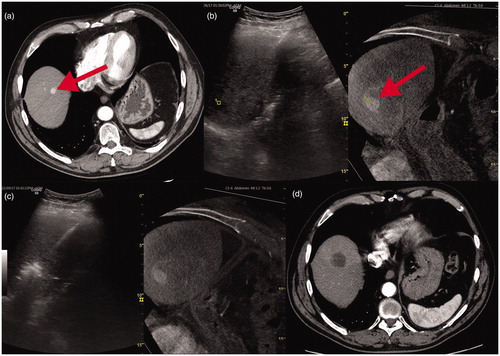
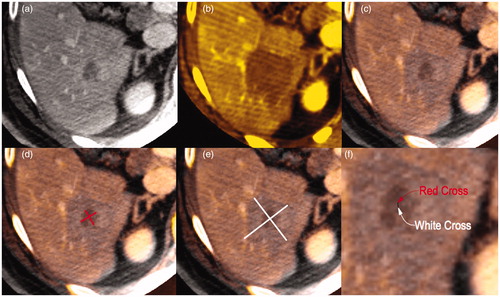
Figure 2. (a) pretreatment and (b) posttreatment CBCT for a 2 cm HCC with a well-defined wash-out in portal phase. (c) pre and post treatment overlapping of both previous CBCTs with Inspace 3d fusion software (see text). (d) centre of HCC (red cross) and (e) centre of necrosis area (white cross) evaluated on fused CBCT images with longitudinal and transverse diameters. (f) distance between the two centre points.