
Figures & data
Table 1. Baseline characteristics of patients with adenomyosis treated with HIFU, HIFU combined with LNG-IUS or HIFU combined with GnRHa.
Figure 1. Ultrasonography and MR imaging from a patient with adenomyosis.
A1. Pre-HIFU ultrasonography showed the hypoechoic lesion. A2. Real-time ultrasound imaging showed the significant grayscale change in the treated area. B1. Contrast-enhanced MRI obtained before HIFU showed the enhancement of the diffuse adenomyosis. B2. MRI obtained one day after HIFU showed the nonperfused area of the lesion without damage to the surrounding normal tissue.
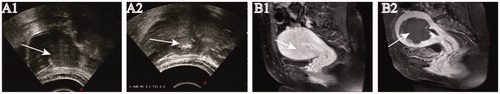
Table 2. HIFU treatment parameters.
Table 3. Evaluation of treatment efficacy in patients with dysmenorrheal.
Table 4. Evaluation of treatment efficacy in patients with menorrhgea after HIFU treatment.
Table 5. Comparison of the uterine volume reduction rate after HIFU treatment.
Table 6. Comparison of the shrinkage rate of the adenomyotic lesion after HIFU treatment in the three groups.