Figures & data
Table 1. Characteristics of participating subjects.
Table 2. Thermal responses and hemodynamic variables during normothermia and LBH.
Figure 1. Serum IL-6 level during LBH in AB TLSCI and CSCI. Data are mean ± SEM. *p < .05, **p < .01, relative to normothermia. AB: able-bodied; TLSCI: thoracic and lumbar spinal cord injury; CSCI: cervical spinal cord injury; NT: normothermia; LBH: lower body heat stress.
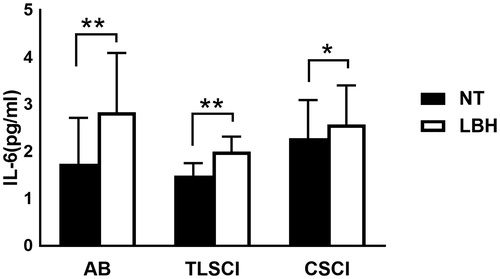
Figure 2. ΔIL-6 in AB TLSCI and CSCI. Data are mean ± SEM. †p < .05, compared with AB; by the post hoc test. AB: able-bodied; TLSCI: thoracic and lumbar spinal cord injury; CSCI: cervical spinal cord injury; NT: normothermia; LBH: lower body heat stress.
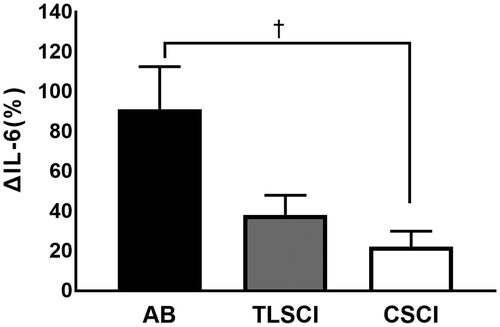
Table 3. Changes in blood cell count, haematocrit, CRP and TNF-α during lower body heat stress.
Figure 3. Plasma adrenaline levels during LBH in AB TLSCI and CSCI. Data are mean ± SEM. †p < 0.05, compared with AB; *p < .05, compared with normothermia; by the post hoc test. AB: able-bodied; TLSCI: thoracic and lumbar spinal cord injury; CSCI: cervical spinal cord injury; NT: normothermia; LBH: lower body heat stress.
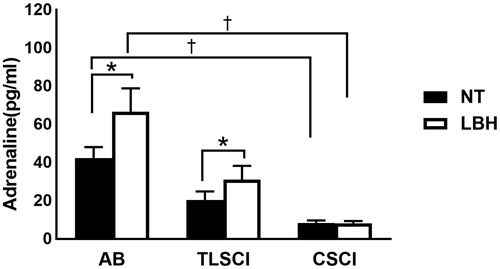
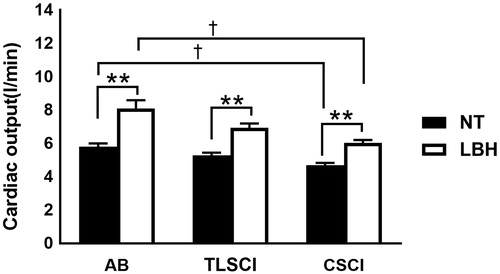
Figure 4. Cardiac output during LBH in AB SCI and CSCI. Data are mean ± SEM. †p < .05, compared with AB; **p < .01, compared with normothermia; by the post hoc test. AB: able-bodied; TLSCI: thoracic and lumbar spinal cord injury; CSCI: cervical spinal cord injury; NT: normothermia; LBH: lower body heat stress.