Figures & data
Figure 1. The experimental setup comprised an ultrasound imaging system, a clinical RFA system equipped with a cool-tip needle electrode, a radiofrequency generator, a peristaltic pump, cables, and accessories. In vitro experiments were performed to validate the proposed method.
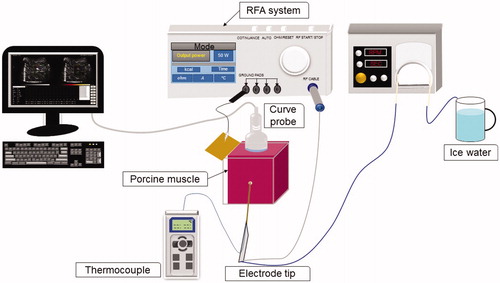
Figure 2. The algorithmic flow chart for ultrasound CBE imaging illustrates use of the sliding-window technique for regional CBE estimations. Conventional and single-phase CBE images were constructed using the strength (magnitude) of CBE and positive CBE values, respectively. The details of the algorithm are presented in the Materials and Methods section.
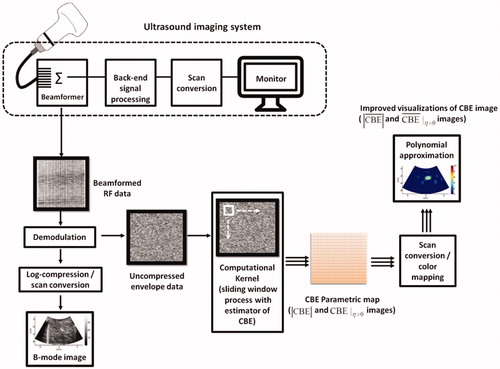
Figure 3. Analysis steps of gross examinations using the software ImageJ to estimate the ablation zone of the tissue sample; the steps comprised greyscale conversion, a thresholding process, and contour segmentations.
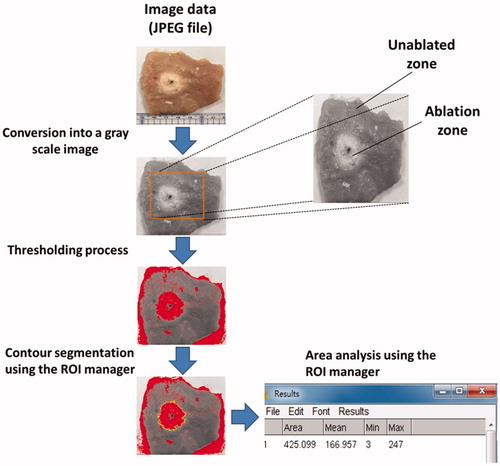
Figure 4. Typical (a) B-mode, (b) , (c)
, (d)
, and (e)
images obtained at various time points and under using temporal compounding (ATL = 0.5 cm). During RFA, areas that were hyperechoic due to the formation of gas bubbles appeared in B-mode images, causing the image brightness to slightly increase in correspondence with the ablation time. In images, the shadowing effect can be observed in the area where the electrode was positioned.
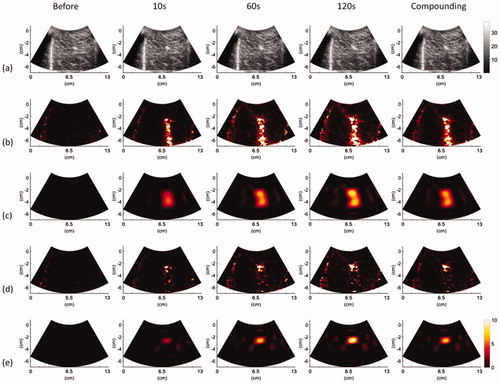
Figure 5. Typical (a) B-mode, (b) , (c)
, (d)
, and (e)
images obtained at various time points and under using temporal compounding (ATL = 1 cm).
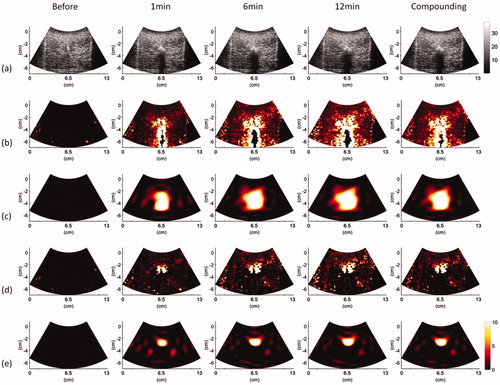
Figure 6. Typical (a) B-mode, (b) , (c)
, (d)
, and (e)
images obtained at various time points and under using temporal compounding (ATL = 1.5 cm).
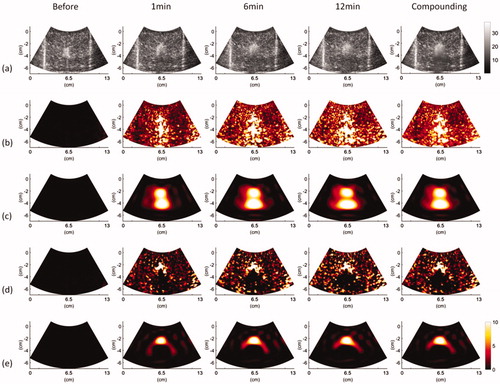
Figure 7. Average pixel values within ROIs in the CBE images (red lines) plotted as a function of time for comparisons with the temperatures of ablated tissues (black lines). (a)–(c) images obtained using ATL = 0.5, 1, and 1.5 cm, respectively; (d)–(f)
images obtained using ATL = 0.5, 1, and 1.5 cm, respectively. For each ATL, the values of
and
increased with time during RFA. In particular,
imaging increased the accuracy of
as a reflection of postablation cooling phases.
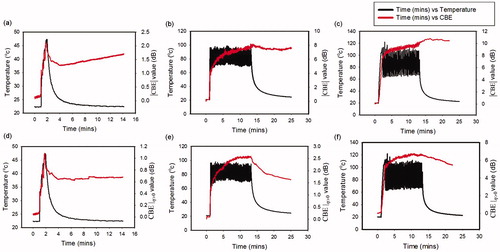
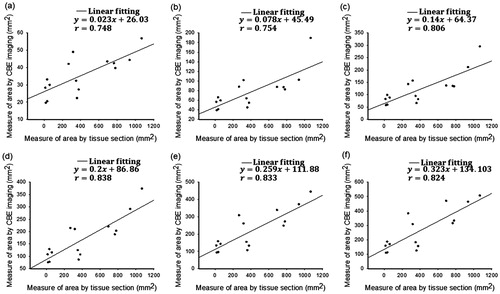
Figure 8. Relationships between the ablation size obtained from gross examination and the SCBE values estimated using images by applying various contour criteria. (a) − 1 dB; (b) − 2 dB; (c) − 3 dB; (d) − 4 dB; (e) − 5 dB; (f) − 6 dB. The results indicated that
-based SCBE values were not adequately correlated with ablation sizes. This is attributed to the effect of shadowing features in conventional ultrasound CBE imaging.
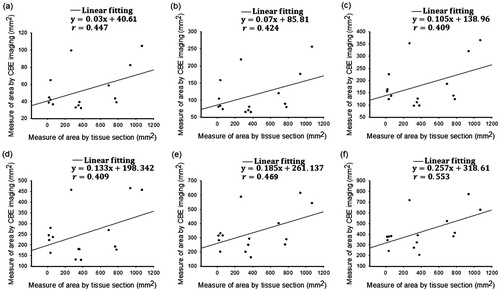
Figure 9. Relationships between the ablation size obtained from gross examination and the SCBE values estimated using images by applying various contour criteria. (a) − 1 dB; (b) − 2 dB; (c) − 3 dB; (d) − 4 dB; (e) − 5 dB; (f) − 6 dB. When the proposed
image was used, the correlation coefficients r between SCBE and ablation sizes significantly increased. Analyses of
images using the more than −3-dB contour criterion produced an r value of >0.8.