
Figures & data
Table 1. Comparison of the baseline characteristics in patient groups with NPVr ≥90% and NPVr <90%.
Table 2. Independent factors associated with an NPVr ≥90%: Multivariate analysis.
Figure 1. A 39-year-old woman with a 138 ml adenomyosis was treated with magnetic resonance imaging (MRI)-guided high-intensity focussed ultrasound (HIFU) ablation. (A) A sagittal T2-weighted (T2W) MR image of the adenomyosis prior to HIFU treatment. (B) A quantitative perfusion MR image was analyzed by drawing a region of interest (ROI) within the area of the adenomyosis lesion and the myometrium on one of the perfusion MR images. (C) The generated Ktrans map. (D) A contrast-enhanced T1-weighted (CE-T1W) MR image obtained immediately after MRI-guided HIFU treatment.
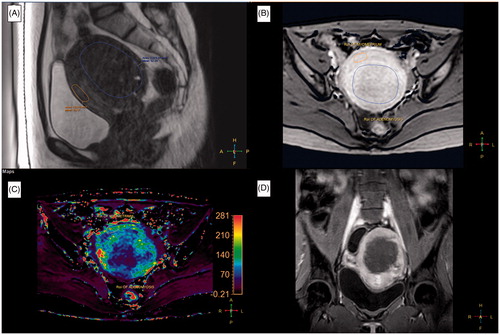
Figure 2. A 38-year-old woman with a 116 ml adenomyosis was treated with magnetic resonance imaging (MRI)-guided high-intensity focussed ultrasound (HIFU) ablation. (A) A sagittal T2-weighted (T2W) MR image of the adenomyosis prior to HIFU treatment. (B) A quantitative perfusion MR image was analyzed by drawing a region of interest (ROI) within the area of the adenomyosis lesion and the myometrium on one of the perfusion MR images. (C) The generated Ktrans map (lower left, left section). (D) A contrast-enhanced T1-weighted (CE-T1W) MR image obtained immediately after MRI-guided HIFU treatment.
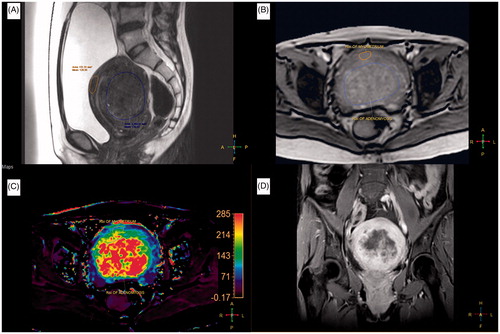
Figure 3. The receiver operating characteristic (ROC) curves of the prediction model in predicting the treatment outcome of high-intensity focussed ultrasound (HIFU) ablation with an immediate nonperfused volume ratio (NPVr) ≥ 90%. Sensitivity, specificity and area under the curve were 0.885, 0.8 and 0.889, respectively.
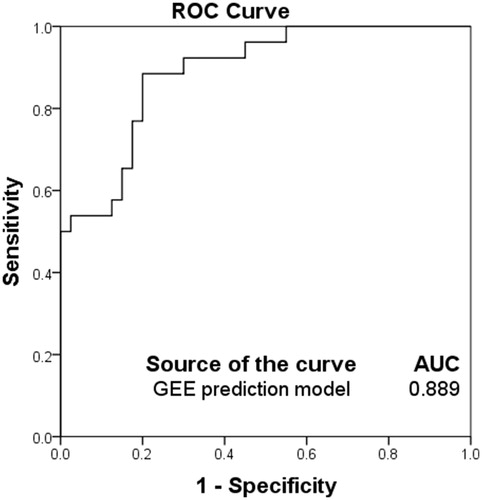
Table 3. Complications and adverse events (AEs) after HIFU ablation in patient groups with NPVr ≥90% and NPVr <90%.
Figure 4. The box plot presents the serum anti-Mullerian hormone (AMH) concentrations before and 6 months after magnetic resonance imaging (MRI)-guided high-intensity focused ultrasound (HIFU) treatment in patients with a nonperfused volume ratio (NPVr) of ≥90% and <90%. Data are presented as box-and-whisker plots.
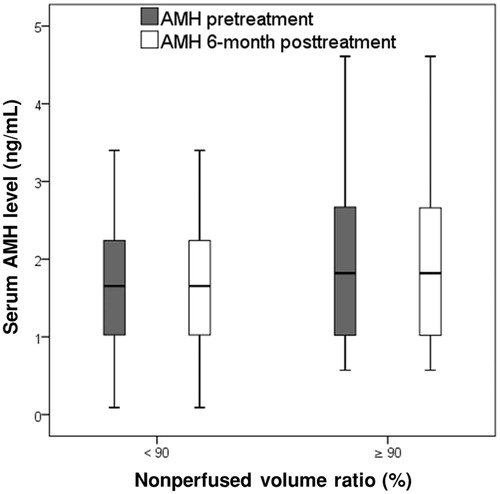
Figure 5. The box plot presents the serum anti-Mullerian hormone (AMH) concentrations before and 6 months after magnetic resonance imaging (MRI)-guided high-intensity focused ultrasound (HIFU) treatment in patients with a nonperfused volume ratio (NPVr) of <50%, ≥50% and <70%, ≥70% and <90% and ≥90%. Data are presented as box-and-whisker plots.
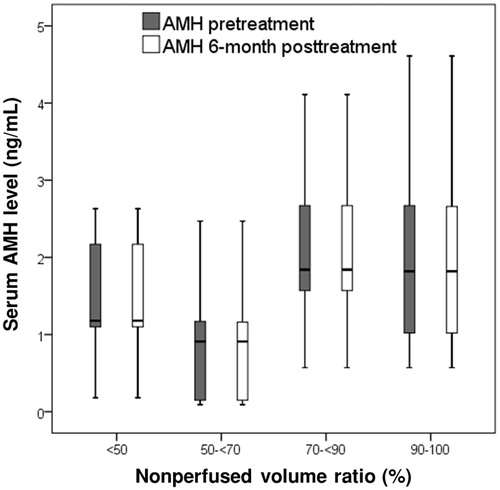
Figure 6. The box plot demonstrates the 6-month fibroid volume reduction ratios and transformed symptom severe score (tSSS) improvement ratios among different groups as a function of a nonperfused volume ratio (NPVr) of ≥90% and <90%. p < .001 is regarded as highly statistically significant.
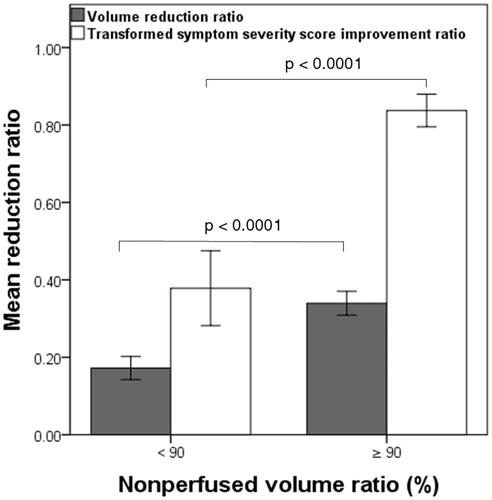
Figure 7. The scatter plot demonstrates tSSS improvement ratios and adenomyosis volume reduction ratios at 6 months for each patient among different groups and subgroups as a nonperfused volume ratio (NPVr) of <50%, ≥50% and <70%, ≥70% and <90% and ≥90%.
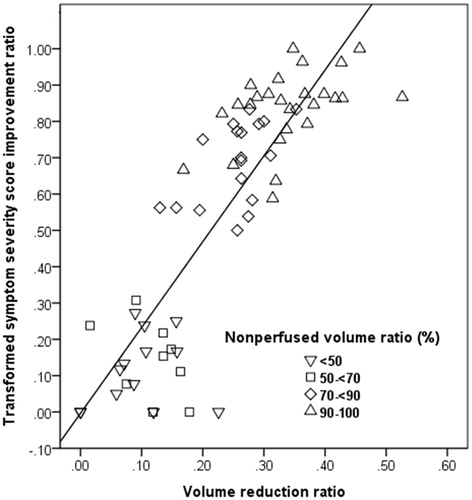
Table 4. Adenomyosis volume and symptom changes in patient groups with NPVr ≥90% and NPVr <90%.
Availability of data and materials
The datasets used and/or analyzed during the current study are not publicly available due the terms of consent to which the participants agreed but are available from the corresponding author on reasonable request.