Figures & data
Figure 1. CONSORT diagram showing the flow of participants through each stage of the randomized trial.
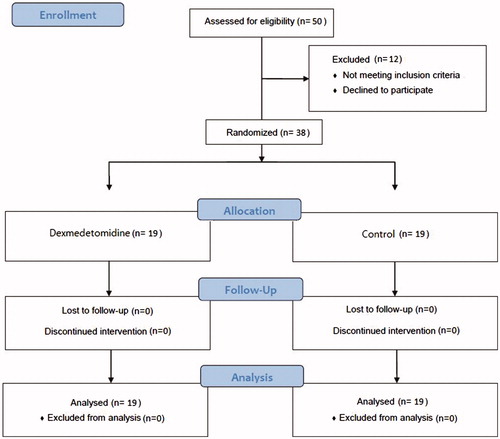
Table 1. Patient characteristics.
Table 2. Perioperative data.
Table 3. Renal outcomes and 30-day morbidity endpoints.
Figure 2. Serial changes in hemodynamic parameters. (A) MAP (mean arterial pressure), (B) HR (heart rate), (C) CI (cardiac index), (D) SVV (stroke volume index), (E) CVP (central venous pressure). Pre-HIPEC: immediately before hyperthermic intraperitoneal chemotherapy (HIPEC); HIPEC: during HIPEC (average of the values assessed at 15 min interval), OP end: immediately after surgery. P Group × Time = p values of the group and time interaction obtained by the linear mixed model. *p < .05 versus control group; †p < .05 versus before surgery. The values are expressed as mean with SD.
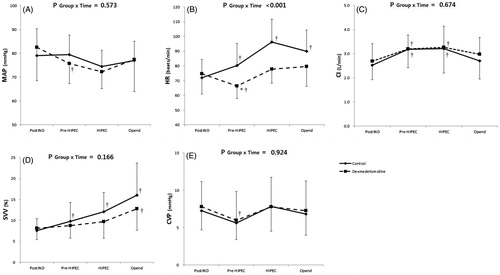
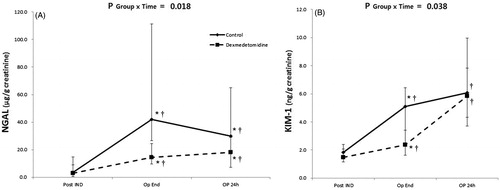
Figure 3. Perioperative urinary biomarkers. Serial changes in urine neutrophil gelatinase-associated lipocaline (NGAL)/creatinine ratio (A) and kidney injury molecule (KIM)-1/creatinine ratio (B). PostIND: after induction of anesthesia; OpEnd: immediately after surgery; OP 24 h: 24 h after surgery. P Group × Time = p values of the group and time interaction obtained by the Brunner–Langer model. *p < .05 versus control group; †p < .05 versus before surgery. The values are expressed as median with IQR.