Figures & data
Figure 2. Modulated electro-hyperthermia (mEHT) suppressed xenograft tumor growth. Flanks of groups of athymic nude mice were inoculated subcutaneously with 3 × 10⁶ OVCAR-3 and SNU-17 cells, and parallel groups were transplanted subcutaneously with patient-derived tumor xenograft pieces of approximately 3 mm in length and width (patient-derived xenograft [PDX]-19, cervical cancer). mEHT was directly applied to the surface of each xenograft tumor at indicated temperature (cell line xenograft: 39 °C or 41 °C for 15 min/day, seven times; PDX-19 xenograft: 39 °C for 15 min/day, 15 times). Subsequently, xenograft tumor diameters were measured daily before applying mEHT using digital calipers. (A) Gross images of tumor masses from xenograft mice from each group. Scale bar =1 cm. (B) Xenograft tumor growth rate. (C) Final volume and weight of xenograft tumor. Results are means ± standard error (SE; OVCAR-3 and PDX-19, n = 3; SNU-1, n = 5/per group (*p <.05 and **p <.01).
![Figure 2. Modulated electro-hyperthermia (mEHT) suppressed xenograft tumor growth. Flanks of groups of athymic nude mice were inoculated subcutaneously with 3 × 10⁶ OVCAR-3 and SNU-17 cells, and parallel groups were transplanted subcutaneously with patient-derived tumor xenograft pieces of approximately 3 mm in length and width (patient-derived xenograft [PDX]-19, cervical cancer). mEHT was directly applied to the surface of each xenograft tumor at indicated temperature (cell line xenograft: 39 °C or 41 °C for 15 min/day, seven times; PDX-19 xenograft: 39 °C for 15 min/day, 15 times). Subsequently, xenograft tumor diameters were measured daily before applying mEHT using digital calipers. (A) Gross images of tumor masses from xenograft mice from each group. Scale bar =1 cm. (B) Xenograft tumor growth rate. (C) Final volume and weight of xenograft tumor. Results are means ± standard error (SE; OVCAR-3 and PDX-19, n = 3; SNU-1, n = 5/per group (*p <.05 and **p <.01).](/cms/asset/53f42dbb-9d0d-42de-b022-859a8150a4b2/ihyt_a_1528390_f0002_c.jpg)
Figure 3. Modulated electro-hyperthermia (mEHT)-exposed cancer cells increased in size and intracellular granularity. OVCAR-3 and HeLa were exposed to mEHT at 43 °C for 1 h and incubated for 0, 24, or 48 h at 37 °C in a CO2 incubator. (A) Cell size was measured at indicated times using automatic cell counter LUNA II (Logos Biosystems, Inc., Republic of Korea). Results are means ± standard error (SE, n = 10, ***p < .001). (B) Cell size (FSC) and intracellular granularity (SSC) of OVCAR-3 cells exposed to mEHT were examined using fluorescence (FACS) analysis with propidium iodide (PI) staining. Representative scatter plots of four separate experiments are shown (top). Quantification of FACS analysis results (bottom, line graph). Results are means ± SE, n = 4 (***p < .001).
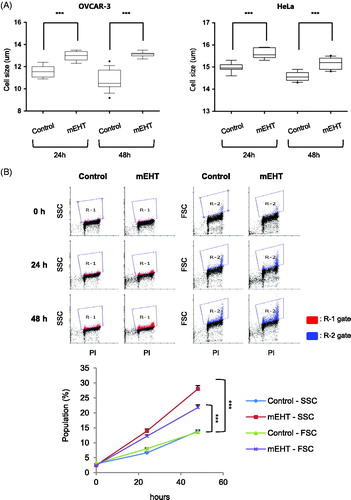
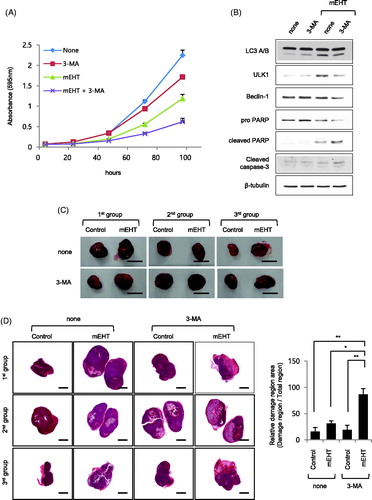
Figure 5. Autophagy protected against apoptosis of modulated electro-hyperthermia (mEHT)-exposed OVCAR-3 ovarian cancer cells. OVCAR-3 ovarian cancer cells were exposed to 43 °C for 1 h in the presence of 1 mM 3-methyladenine (3-MA) using mEHT device for up to 96 h. (A) Cell viability was measured using crystal violet assay. Results are means ± standard error (SE, n = 4). (B) OVCAR-3 cells were incubated for 24 h after mEHT exposure at 43 °C for 1 h, and then harvested to prepare protein lysates. Indicated protein expression levels were examined using western blot analyses. (C) Athymic nude mice were inoculated subcutaneously in one flank with 3 × 10⁶ OVCAR-3 cells. After 15 days, xenograft cancer tissues were exposed to 39 °C for 15 min in the presence of 2 mg/kg 3-MA using mEHT device. Subsequently, mice were euthanized and xenograft cancer tissues were harvested 12 h after treatment with mEHT and 3-MA. Gross images of tumor masses from xenograft mice from each group. Scale bar = 1 cm. (D) Slides of sectioned formalin-fixed paraffin-embedded (FFPE) xenograft cancer tissue blocks were stained using hematoxylin and eosin (H&E, left, tissue images). Scale bar = 2.5 mm. Measured area was quantified using ImageJ 1.48v software (right, bar graph). Results are means of relative ratio value of damage area in cancer tissue ± SE, n = 3 (*p < .05 and **p < .01).