
Figures & data
Figure 1. Four quadrants used to describe direction of local tumor progression from center of tumor. The tumor was divided into four quadrants by two orthogonal planes (axial and vertical planes) crossing at the center of the tumor. (Q is short for Quadrant).
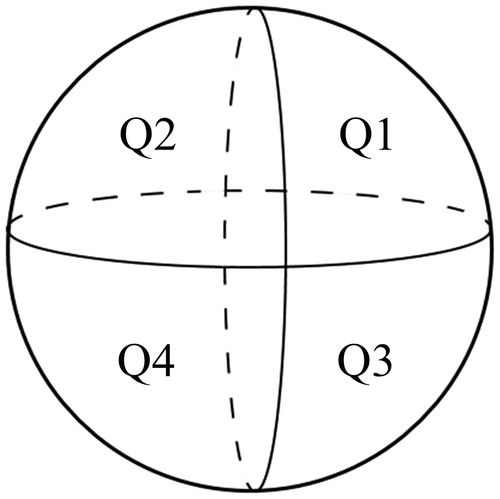
Figure 2. Flow chart of the present study. RFA: radiofrequency ablation; 3DCEUS: three-dimensional contrast-enhanced ultrasound; CT: computed tomography; ICA: incomplete ablation; AM: ablative margin; LTP: local tumor progression.
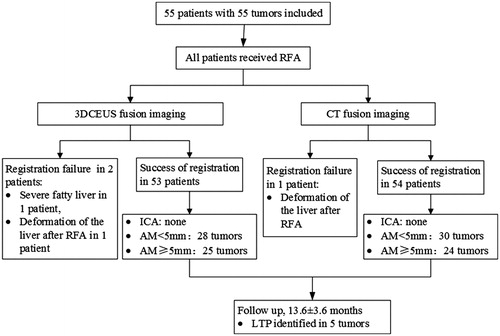
Table 1. Demographic characteristics and index tumor profiles of 55 patients.
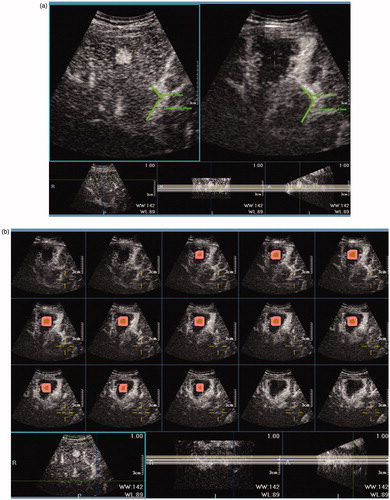
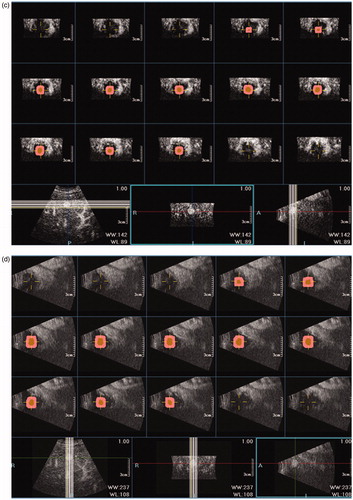
Figure 4. 3DCEUS and CT fusion of an insufficient ablative margin in a 57-year-old man with HCC. (a): The ablation zone (marked in red line) covered the tumor (marked in orange) completely after 3DCEUS fusion, but 5 mm ablative margin was not achieved on the upper-left (Quadrant 1) of the tumor. (b): CECT obtained before RFA showed a low-attenuating tumor (arrow) in venous phase. (c): CECT obtained 1 month after RFA showed the ablation zone in arterial phase. The treatment response was considered complete ablation. (d): CT fusion showed the tumor was covered by translucence ablation zone (green) successfully, but it was an eccentric overlap. (e): The pre-RFA tumor was overlaid on the post-RFA images. It was shown that ablative margin was insufficient on Quadrant 1 as the ablation zone margin (green) intersected with the tumor margin and did not cover 5 mm ablative margin area (purple). (f): CECT obtained 7 months after RFA shows LTP as peripheral hypo-enhanced lesion (arrow) adjacent to the treated area in venous phase. LTP occurred in the section where 5 mm ablative margin was not achieved.
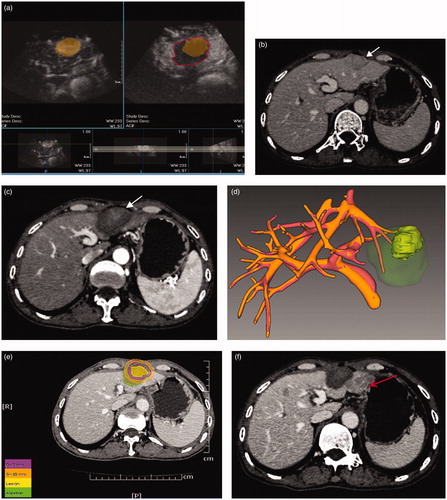
Table 2. Comparative evaluation of 3DCEUS fusion imaging with CT fusion imaging in the assessment of AM for 53 patients who were successful both on 3DCEUS and CT fusion imaging.
Figure 5. Curves of local tumor progression, calculated by the Kaplan–Meier method, according to the presence or absence of AM ≥5 mm. The log-rank test result shows that over time the presence or absence of AM ≥5 mm by 3DCEUS fusion was associated with a significantly higher rate of local tumor progression.
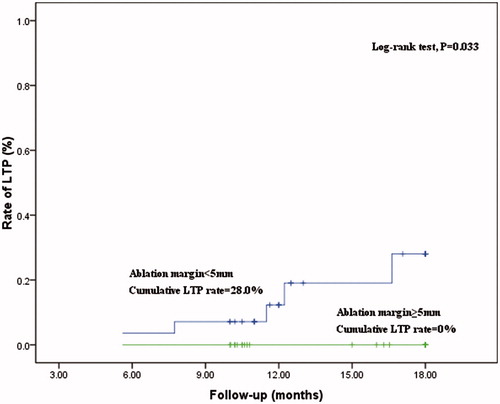
Table 3. Determinants of LTP by Kaplan–Meier method and log-rank test in 53 patients that were successful both on 3DCEUS and CT fusion imaging.