Figures & data
Table 1. Physical characteristics of the subjects.
Table 2. Body temperature before and after lower-body heating.
Figure 1. The reflex amplitude of Hmax (A), Mmax (B), Vsup (C), and Hmax/Mmax amplitude ratio (D) of soleus muscle in groups of young and older men before and after lower-body heating. *p < .05, compared with before; #p < .05, compared with young men. Values are expressed as means and SEM.
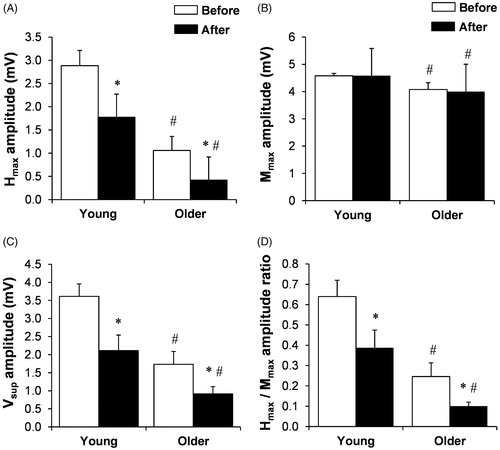
Figure 2. The reflex latency of Hmax (A), Mmax (B), Vsup (C), and Hmax/Mmax latency ratio (D) of soleus muscle in groups of young and older men before and after lower-body heating. *p < .05, compared with before; #p < .05, compared with young men. Values are expressed as means and SEM.
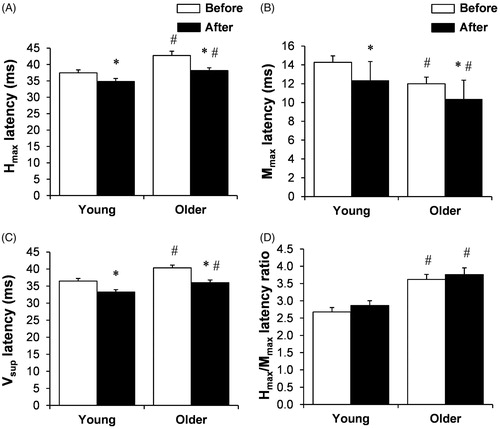
Figure 3. Lower-body heating induced change in Hmax, Vsup, and Mmax reflex wave latency time in young and older men. #p < .05, compared with young men, mean difference in percent between before and after lower-body heating. Values are expressed as means and SEM.
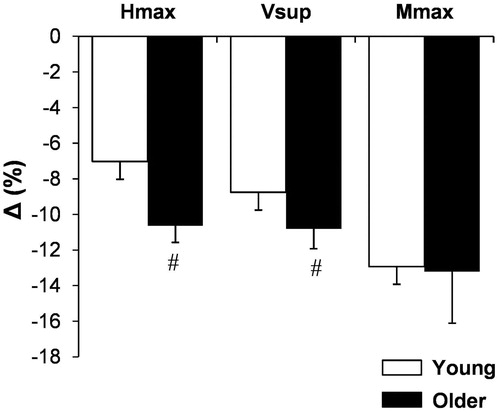
Figure 4. The root mean square (RMS) values (A) and mean frequency (MnF) values (B) of the surface EMG signal of soleus muscle during the 5-s MVC before and after lower-body heating in groups of young and older men. *p < .05, compared with before; #p < .05, compared with young men. Values are expressed as means and SEM.
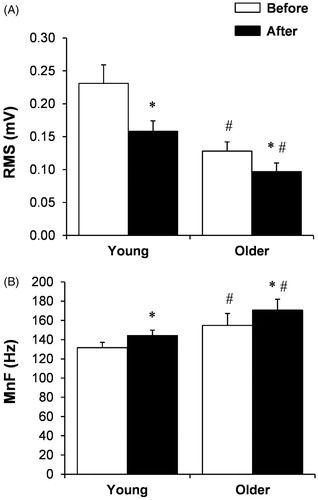
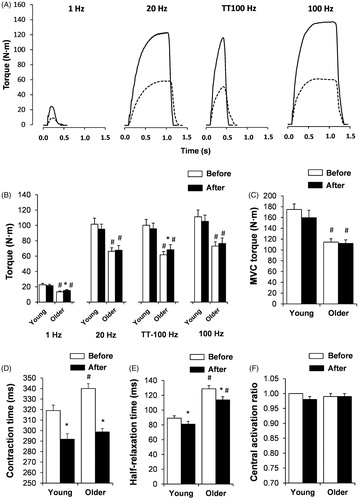
Figure 5. Representative torque records (A) of electrically stimulated contractions at 1, 20, TT-100, and 100 Hz in ankle plantar flexion muscles of a young (solid lines) and older (dashed lines) men obtained in thermoneutral conditions (i.e. before lower-body heating). The electrically induced ankle plantar flexion muscle isometric torque by stimuli at 1, 20, TT-100, and 100 Hz (B), maximal voluntary contraction (MVC) torque (C), contraction time (D) and half-relaxation time (E) indicated by the PTT100-induced muscle contraction, and central activation ratio, (F) before and after passive lower-body heating in groups of young and older men. *p < .05, compared with before; #p < .05, compared with young men. Values are expressed as means and SEM.