Figures & data
Figure 1. Mice in the experimental with laser ablation. (A) An high-frequency ultrasound-guided laser fiber into the center of the tumor. (B) When started ablation, red bright spot was seen in the tumor center. (C) Real-time display of working power on operating panel.
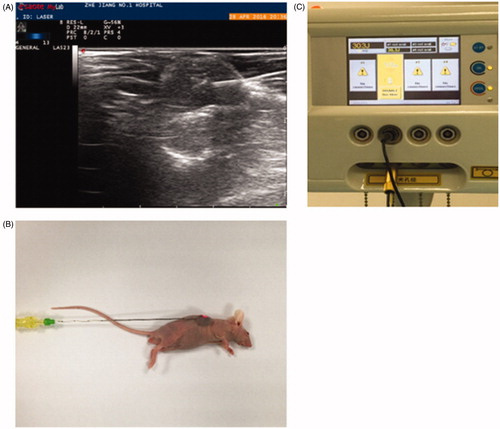
Figure 2. Apoptosis expression in the control group and the experimental group in the first stage. (A) TUNEL staining showed the ratio of apoptotic cells after incompleted ablation. (B) Apoptosis Index of the control and experimental group. (C) Caspase-3 protein expression. (D) Caspase-3 protein relative expression levels. Significant differences were calculated with respect to the control group. *p < .05.
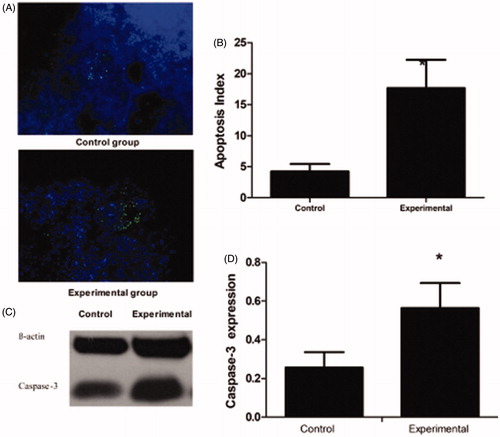
Figure 3. HSP90α, HSP70, and HSP27 expression levels in the control and the experimental group. Significant differences were calculated with respect to the control group. *p < .05.
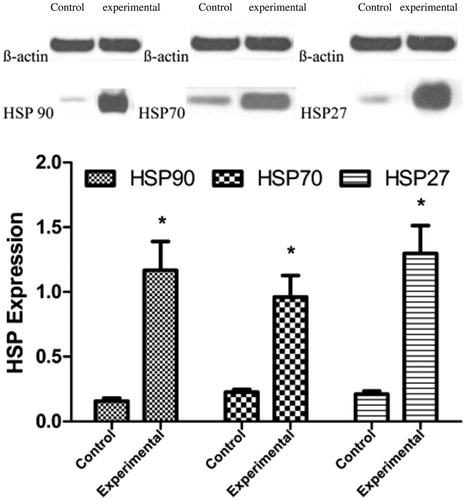
Figure 4. Autophagy expression in the control group and the experimental group in the first stage. (A) LC3 immunofluorescence: LC3-EGFP puncta and DAPI nuclei staining are shown. (B) LC3 immunofluorescence Index (C) LC3II/I protein expression. (D) LC3II/I protein relative expression level. (E) P62 protein expression. (F) P62 protein relative expression levels. Significant differences were calculated with respect to the control group. *p < .05.
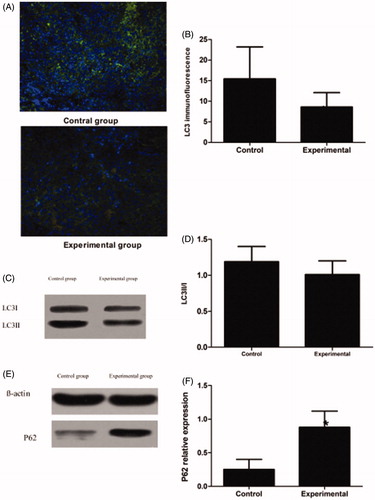
Figure 5. (A) The western blotting bands of P-akt, akt, P-mTOR, and mTOR in the first stage. (B) P-akt、akt、P-mTOR、mTOR expression levels in the control and experimental groups. Significant differences were calculated with respect to the control group. *p < .05.
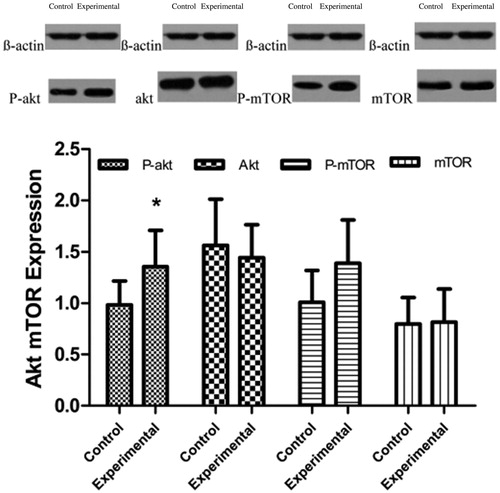
Figure 6. Apoptosis expression in the DSMO group and the HSP90 inhibition group in the second stage. (A) TUNEL staining showed the ratio of apoptotic cells in the groups. (B) Apoptosis Index of the DSMO group and the HSP90 inhibition group. (C) Caspase-3 protein expression. (D) Caspase-3 protein relative expression levels. Significant differences were calculated with respect to the DMSO group. *p < .05.
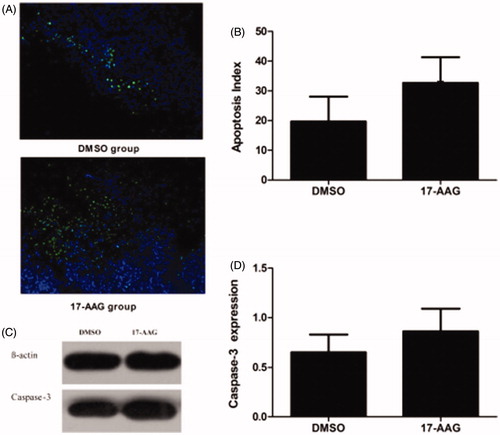
Figure 7. HSP90α expression in (A) DMSO and (B) 17-AAG group. Significant differences were calculated with respect to the DMSO group. *p < .05.
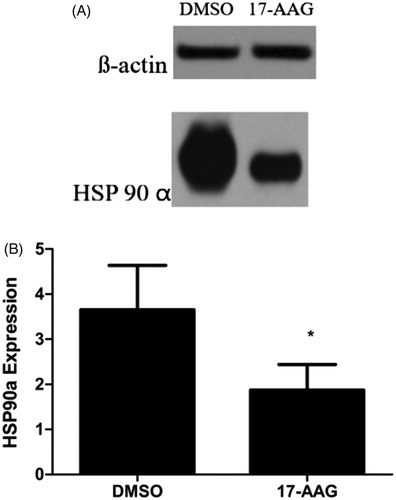
Figure 8. Autophagy expression in the DSMO group and the HSP90 inhibition group in the second stage.(A) LC3 immunofluorescence: LC3-EGFP puncta and DAPI nuclei staining are shown. (B) LC3 immunofluorescence Index. (C) LC3II/I protein expression. (D) LC3II/I protein relative expression level. (E) P62 protein expression. (F) P62 protein relative expression levels. Significant differences were calculated with respect to the DMSO group. *p < .05.
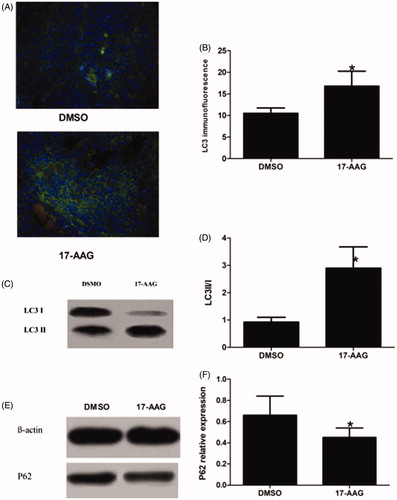
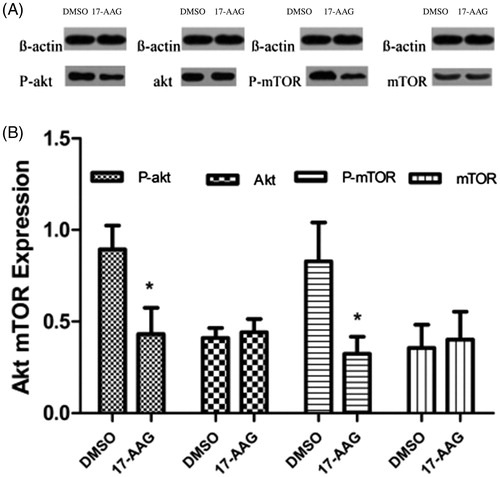
Figure 9. (A) The western blotting bands of P-akt, akt, P-mTOR, and mTOR in the second stage. (B) P-akt, akt, P-mTOR, and mTOR expression levels in the DMSO and 17-AAG groups. Significant differences were calculated with respect to the DMSO group. *p < .05.