Figures & data
Figure 1. A schematic of the triggering mechanism from the porous core-shell nanostructures. Melting of the protective shell results in formation of preferred routes for controlled drug release.
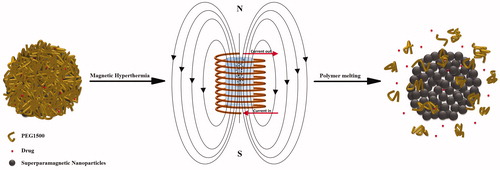
Figure 2. A typical HIFU procedure performed for sonication of a tissue-mimicking phantom containing superparamagnetic nanoparticles. Formation of a dark area around the particles container in the tissue-mimicking phantom indicated partial melting of the polymer and exposure of the magnetic core.
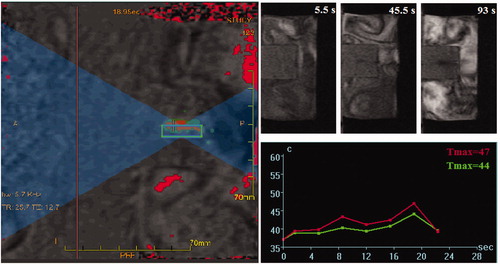
Figure 3. A schematic of the approach used for heating the solution containing superparamagnetic nanoparticles under exposure to an AMF. The tube containing SBF solution and nanoparticles was embedded in a tissue-mimicking phantom and exposed to the AMF with different experimental parameters.
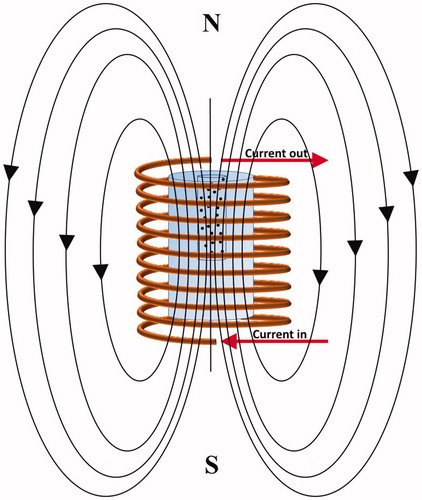
Table 1. The experimental characteristics applied in the magnetic nanoparticle hyperthermia tests.
Figure 4. The XRD spectrum of the synthesized PEG1500-PMNPs. The obtained peaks confirmed formation of magnetite phase with cubic structure. A wide stretch at left side of the spectrum also showed the presence of amorphous polymeric phase.
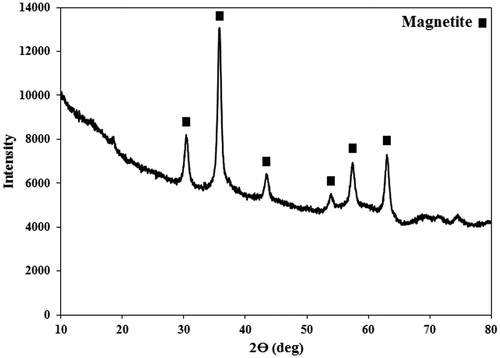
Figure 5. FTIR spectra of (a) PEG1500, (b) pure PMNPs, and (c) PEG1500-PMNPs. The main peaks of both PEG1500 and PMNPs were observed in the FTIR spectrum of PEG1500-PMNPs.
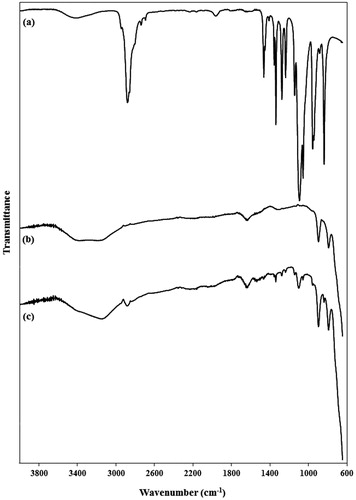
Figure 6. TEM image of the synthesized (a) PMNPs and (b) PEG1500-PMNPs. A thin polymeric nanoshell is observed on the surfaces of PEG1500-PMNPs.
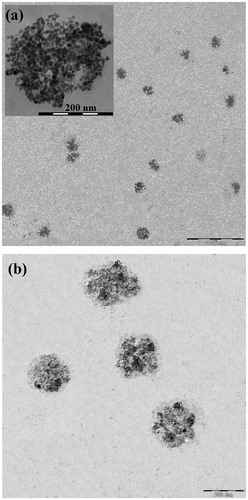
Figure 7. (a) The TGA and (b) DSC analyses of the synthesized PEG1500-PMNPs.
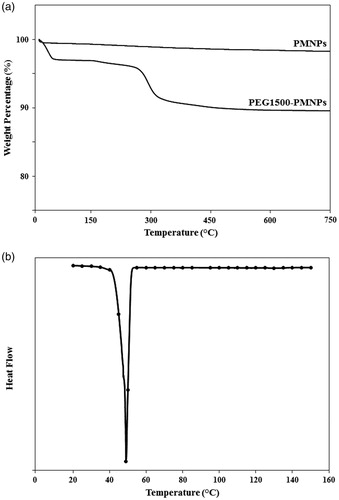
Figure 8. The magnetization curves of PMNPs and PEG1500-PMNPs. In spite of a significant increase of their size, the coercivity values of both PMNPs and PEG1500-PMNPs were near to zero.
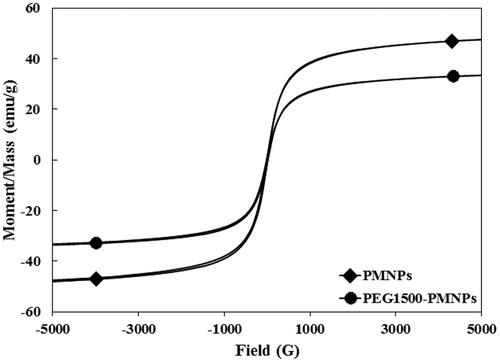
Figure 9. The temperature profiles of the SBF solutions containing PEG1500-PMNPs obtained after exposure to the AMF with varied strengths and different durations. The time of 15 min was found as the optimal interval for all three selected field strengths. However, the 63.0 kA·m−1 AMF could only provide a temperature above melting point of PEG1500 at this interval.
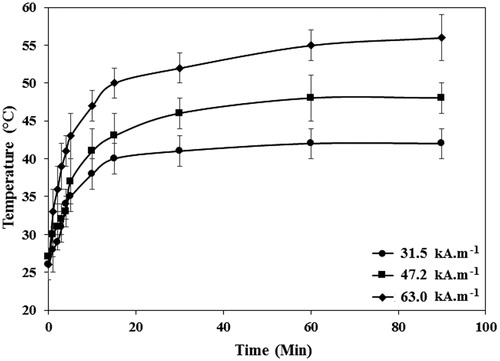
Table 2. The morphological/physical characteristics of PMNPs and PEG1500-PMNPs as well as the drug loading/release behavior of PEG1500-PMNPs.
Figure 10. The nanoparticles ability in (a) encapsulation and (b) release of DOX used as a model drug.
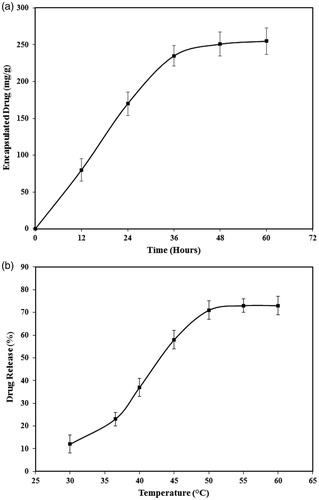
Figure 11. A typical TEM image of PEG1500-PMNPs after heating at 50 °C. Melting of the polymeric shell resulted in formation of large nanoparticle aggregates in the solution. Numerous individual nanoparticles detached from the initial agglomerates were also observed in the solution.
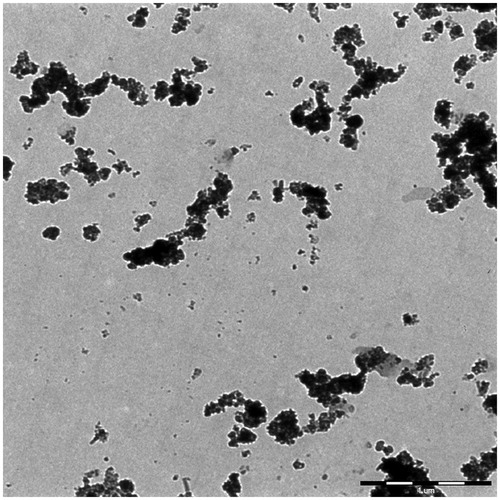
Figure 12. The cytotoxic effects exerted by 160 µg·ml−1 PEG1500-PMNPs, 30 µg·ml−1 free DOX, and 200 µg·ml−1 DOX-PEG1500-PMNPs against the A549 cells after 24, 48, and 72 h.
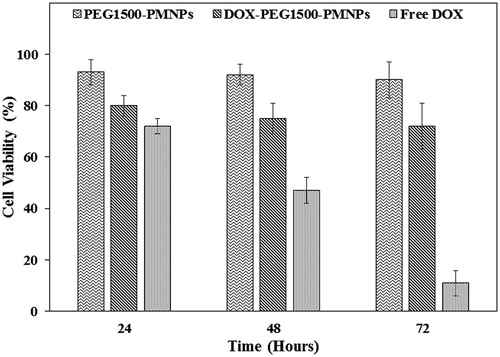
Figure 13. The temperature profiles of the media containing 160 µg·ml−1 PEG1500-PMNPs obtained after exposure to the AMF with varied strengths and durations. The minimum field strength required to achieve temperatures above the PEG1500 melting point was 94.5 kA·m−1.
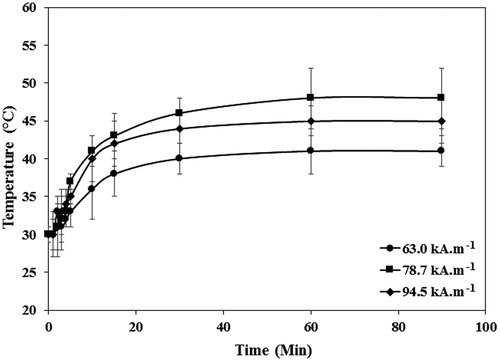
Figure 14. The cell viability ratios of the control A549 cells and those treated with 160 µg·ml−1 PEG1500-PMNPs, 30 µg·ml−1 free DOX, and 200 µg·ml−1 DOX-PEG1500-PMNPs after exposure to the magnetic hyperthermia condition.
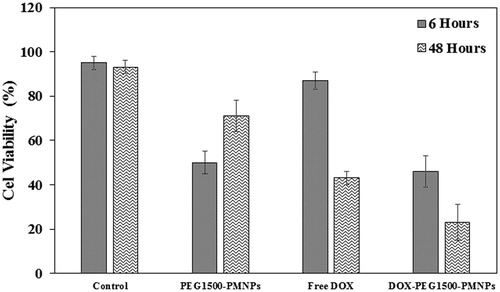
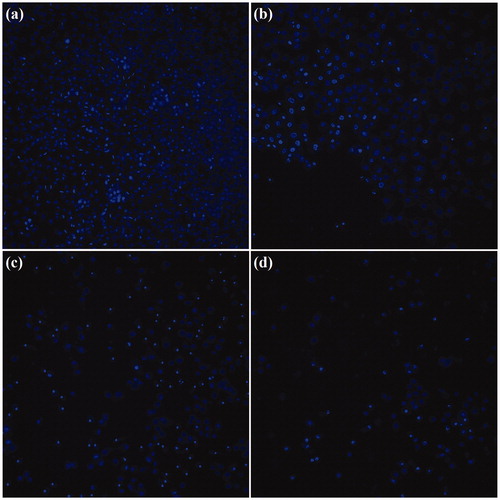
Figure 15. The CellReporter images of the stained A549 cells after hyperthermia treatments. (a) Control, (b) PEG1500-PMNPs, (c) free DOX, and (d) DOX-PEG1500-PMNPs.