Figures & data
Table 1. Primer sequences and amplicon characteristics.
Figure 1. Effects of heat stress on HSP70 expression and NF-κB activity. The levels of HSP70, cytosolic and nuclear p65, and phospho-p65 (a) in IPEC-J2 cells challenged by heat stress for 1.5 h followed by recovery for 1.5 h. Changes in HSP70 expression (b). Ratios of nuclear and cytoplasmic p65 heat stress (c). Ratios of nuclear phospho-p65 to p65 after heat stress for (d). *p ≤ .05, **p ≤ .01.
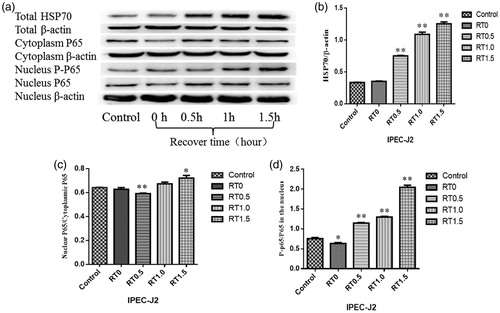
Figure 2. Construction of an SOCS3, SOCS4 and HSP70 ectopic expression system and cotransfection in vitro. The SDS-PAGE: PCR product of the SOCS3 plasmid (a), PCR product of pcDNA 3.1/V5-His-SOCS3 (b), PCR product of the SOCS4 plasmid (c) and PCR product of pcDNA 3.1/V5-His-SOCS4 (d). Western blot analysis of SOCS3 (e), HSP70 (f) and SOCS4 proteins (g) in 293 T cells that transfected by their ectopic expression vectors, respectively. The expressing of HSP70 in supernatant of cells that co-transfected by HSP70 + pNF-κB-Luc + pRL-YK also was detected (h). qRT-PCR analysis of HSP70 and SOCS3 mRNA levels in 293T cells (i) and IPEC-J2 cells (j) transfected with empty, HSP70 + pNF-κB-Luc + pRL-YK, SOCS3 + pNF-κB-Luc + pRL-YK or HSP70 + SOCS3 + pNF-κB-Luc + pRL-YK vectors. HSP70 and SOCS4 expression in 293T cells (k) and IPEC-J2 cells (l) transfected by empty, HSP70 + pNF-κB-Luc + pRL-YK, SOCS4 + pNF-κB-Luc + pRL-YK or HSP70 + SOCS4 + pNF-κB-Luc + pRL-YK vectors. Empty refers to pcDNA 3.1/V5-His vector that was not linked to a gene. *p ≤ .05, **p ≤ .01. Lanes 1 and 2 in (b) show PCR products of the SOCS3-ORF and pcDNA 3.1/V5-His-SOCS3 vectors; lanes 1 and 2 in (d) show the PCR products of the SOCS4-ORF and pcDNA 3.1/V5-His-SOCS4 vectors.
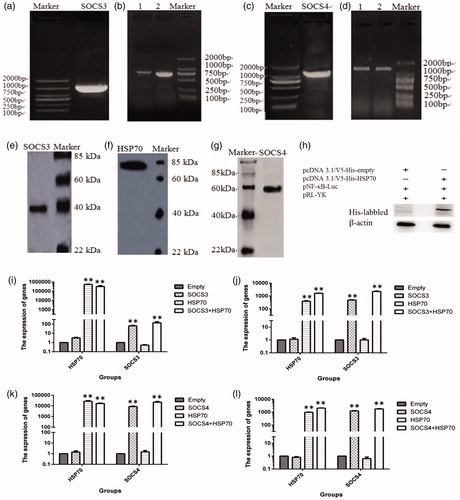
Figure 3. SOCSs decreased the activity of NF-κB induced by HSP70 overexpression. Cells were cotransfected with the NF-κB reporter system (pNF-κB and pRL-YK) and SOCS3 + HSP70 (a) or SOCS4 + HSP70 (b) and then exposed to TNF-α for 6 h. Finally, activation of NF-κB was measured using dual luciferase reporter assays. The levels of IKBα and phospho-IKBα were detected by western blotting in 293T cells and IPEC-J2 cells transfected with SOCS3 + HSP70 (c, e) and SOCS4 + HSP70 (d, f). Data in (e) and (f) are from one representative experiment with three technical replicates (means ± standard deviations) and were statistically analyzed by one-way ANOVA. **p ≤ .01. All experiments were repeated three times.
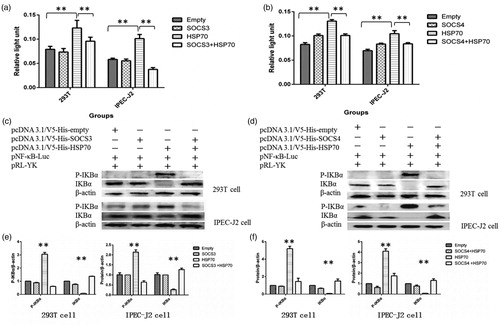
Figure 4. SOCSs knockdown abolished NF-κB activity in HSP70-expressing cells. Cells were transfected with the NF-κB reporter system (pNF-κB and pRL-YK) and siSOCS3 + SOCS3 + HSP70 (a) or siSOCS4 + SOCS4 + HSP70 (b), and the activation of NF-κB was measured using dual luciferase reporter assays. The levels of IKBα and phospho-IKBα were detected by western blotting in 293T cells and IPEC-J2 cells transfected with siSOCS3 + SOCS3 + HSP70 (c, e) and siSOCS4 + SOCS4 + HSP70 (d, f). Data in (e) and (f) are from one representative experiment with three technical replicates (means ± standard deviations) and were statistically analyzed by one-way ANOVA. *p ≤ .05, **p ≤ .01. All experiments were repeated three times.
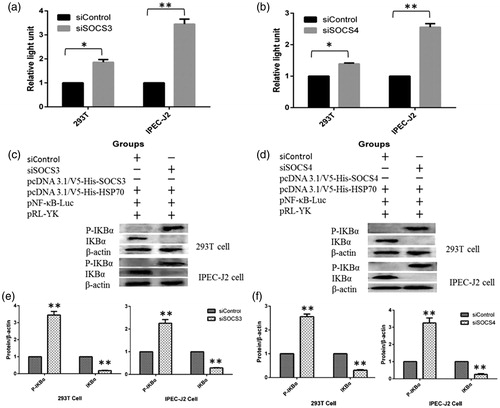
Figure 5. SOCS3, but not SOCS4, decreased the expression of MyD88-adapter-like (Mal) protein induced by HSP70. Changes in the expression of Mal protein in HSP70-overexpressing cells and cells with SOCS3 cotransfection (a, b). Changes in Mal protein expression following cotransfection with SOCS4 and HSP70 (c–e). Data in (b) and (e) are from one representative experiment with three technical replicates (means ± standard deviations) and were analyzed by one-way ANOVA. **p ≤ .01. All experiments were repeated three times.
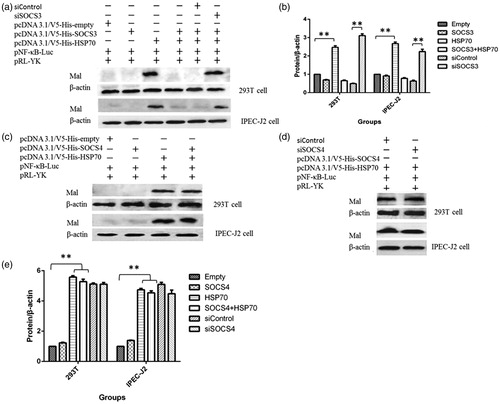
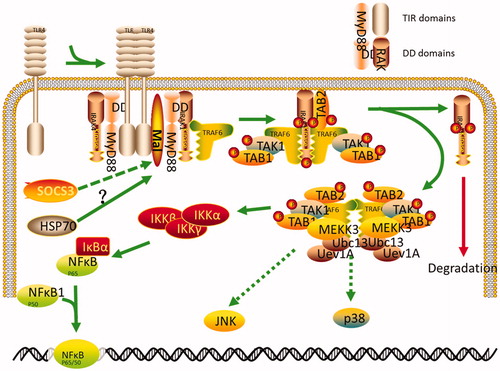
Figure 6. The putative signaling pathway of SOCS3 in HSP70-overexpressing cells. HSP70 released from HSP70-transfected cells may interact with TLR2 or TLR4 in these cells and lead to activation of NF-κB. This pathway can then be disrupted by SOCS3 or SOCS4 cotransfection. SOCS3, but not SOCS4, negatively regulates the activity of NF-κB via degradation of Mal protein in 293T cells and IPEC-J2 cells.