Figures & data
Table 1. Characteristics of patients.
Figure 1. Representative images of: baseline 99mTc thyroid scintiscan (A); ultrasound scan of toxic nodule before laser ablation (B); ultrasound scan 6 months after laser ablation (C); ultrasound scan 6 months after radioactive treatment and 12 months after laser ablation (D).
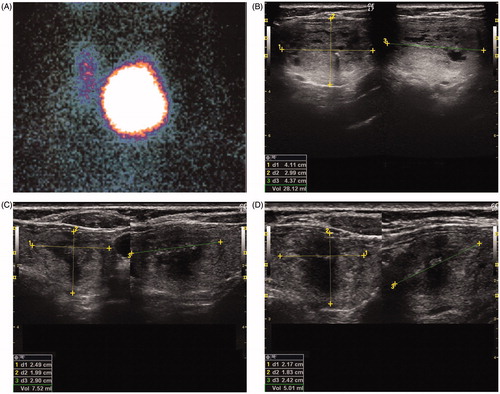
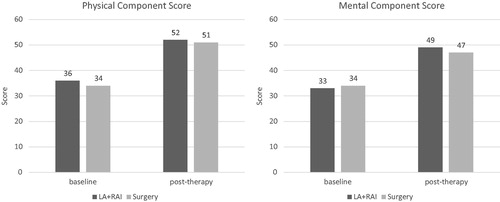
Figure 2. Health-related quality of life scores before and after treatment.