Figures & data
Figure 1. HCC cells survived sublethal heat treatment via autophagy. (A) Cell proliferation of heat-treated (47 °C for 10 min) residual HCC cells (Huh7, MHCC97H, HepG2 and HCCLM3) was significantly suppressed compared with that of control cells treated by 37 °C for 10 min. (B) The mRNA expression of autophagy-related genes (ATG5, ATG7, Beclin1, LC3B, P62) were examined by quantitative RT-PCR. (C) The expression of LC3-II in heat-treated (47 °C for 10 min) residual HCC cells was significantly higher than that in control cells treated by 37 °C for 10 min, as indicated by Western blotting. The zero time represents the end of heat shock (47 °C for 10 min). (D) The growth latency of heat-treated residual HCC cells under ischemic (1% FBS) vs standard (10% FBS) condition was shown. (E) Compared with control cells treated by 37 °C for 10 min, an increase of the proportion of G0/G1phase in heat-treated (47 °C for 10 min) residual HCC cells cultured under ischemic (1% FBS) vs standard (10% FBS) condition. (F) LC3-II expression in heat-treated (47 °C for 10 min) residual HCC cells under ischemic (1% FBS) condition was increased gradually and maintained for one week, as indicated by Western blotting. LC3-II level in heat-treated (47 °C for 10 min) residual HCC cells cultured under ischemic (1% FBS) vs standard (10% FBS) condition was further upregulated in the presence of CQ (10 μM). **, p < .01; *, p < .05.
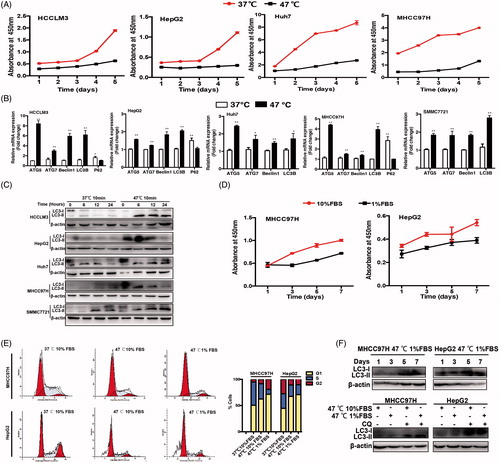
Figure 2. Autophagy was activated in heat-treated surviving HCC cells. Representative images of an increase of autophagic flux indicated by punctate mRFP-EGFP-LC3 fusion protein under confocal microscopy (A) and AVs (black arrows) by TEM and the bar charts indicate quantification (B). Cell apoptosis of heat-treated (47 °C for 10 min) residual HCC cells cultured under ischemic (1% FBS) vs standard (10% FBS) condition in the presence of CQ (10 μM) was detected using flow cytometric analysis (C) and cleaved-caspase-3 (D).
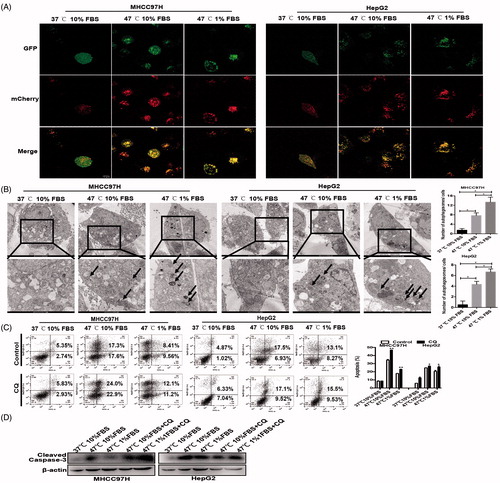
Figure 3. HSC-CM decreased cell apoptosis and promoted proliferation of heat-treated residual HCC cells via regulating autophagy. (A) Immunofluorescence staining of α-SMA in activated HSCs cells LX2 and pHSCs. (B) HSC-CM promoted autophagic survival within 24 h and decreased apoptosis in heat-treated (47 °C for 10 min) residual HCC cells cultured under ischemic (1% FBS) condition, as indicated by LC3-II and cleaved Caspase-3. (C) HSC-CM decreased autophagy and promoted proliferation of heat-treated (47 °C for 10 min) residual HCC cells cultured under ischemic (1% FBS) condition, as indicated by LC3-II and CyclinD1. Expression levels of LC3-II and CyclinD1 were normalized to β-actin. (D) Analysis of growth curves of heat-treated (47 °C for 10 min) residual HCC cells under ischemic (1% FBS) condition cultured with HSC-CM, as indicated by WST-1 assay. (E) Apoptosis of heat-treated (47 °C for 10 min) residual HCC cells under ischemic (1% FBS) vs standard (10% FBS) condition and cultured with HSC-CM in the presence of CQ (10 μM) was determined using Annexin V/PI staining assay. (F) The protein expression of autophagy (LC3-II) and apoptosis (cleaved Caspase-3) in heat-treated (47 °C for 10 min) residual HCC cells under ischemic (1% FBS) vs standard (10% FBS) condition and cultured with HSC-CM in the presence of CQ (10 μM) were determined by Western blotting. LX2-CM: conditioned media from LX2 cells; pHSC-CM: conditioned media from primary HSCs. **, p < .01; *, p < .05, bar = 1 mm.
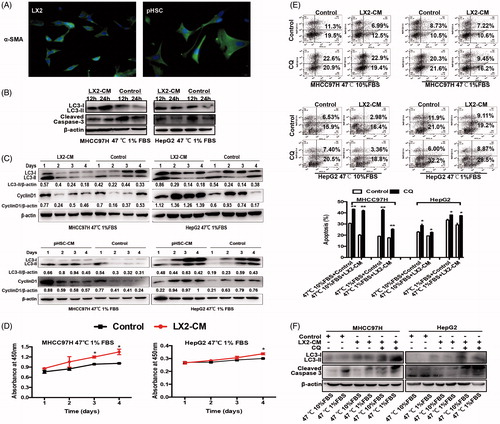
Figure 4. HGF mediated the protective effects of HSC-CM via regulating autophagy. The presence of HGF in HSC-CM was identified by cytokine profiles (A) and ELISA assay (B). The correlation between of HGF and COL1A1 expression in HCC cohorts from TCGA (C). (D, E) The alterations of cell growth and c-Met phosphorylation, LC3B-II, P62, CyclinD1 and cleaved caspases-3 protein expression in heat-treated (47 °C for 10 min) residual HCC cells under ischemic (1% FBS) condition cultured with HSC-CM, or in the presence of HGF-neutralizing antibody or c-Met inhibitor (PHA). (F) Autophagy (LC3B, P62, ATG5, Beclin1), CyclinD1 and cleaved caspases-3 protein expression in heat-treated (47 °C for 10 min) residual HCC cells cultured under ischemic (1% FBS) condition in response to HGF (0, 2, 10, 50 ng/ml) was detected by Western blotting. Cell growth curve (G) and decrease of the proportion of G0/G1phase (H) and cell apoptosis (I) of heat-treated (47 °C for 10 min) residual HCC cells cultured under ischemic (1% FBS) condition in response to HGF in response to HGF (0, 2, 10, 50 ng/mL). LX2-CM: conditioned media from LX2 cells; pHSC-CM: conditioned media from primary HSCs. **, p < .01; *, p < .05.
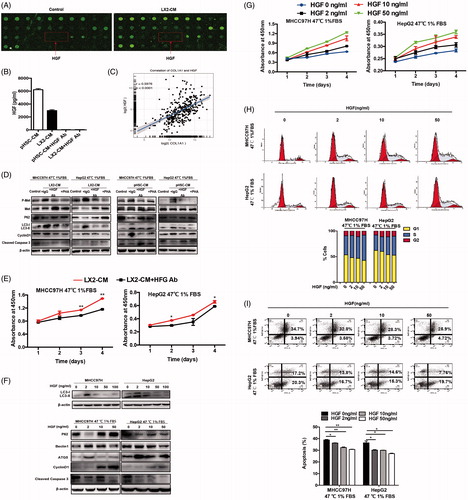
Figure 5. HGF/c-Met signaling in autophagy and proliferation of heat-treated residual HCC cells. (A) The correlation analysis between MAPK1 (ERK2) and CyclinD1 expression in HCC data from TCGA. c-Met phosphorylation (at tyrosine residues 1234 and 1235) and ERK1/2 phosphorylation of heat-treated (47 °C for 10 min) residual HCC cells under ischemic (1% FBS) condition were significantly up-regulated by HSC-CM (B) or HGF in time and dose-dependent manners (D, E). Addition of c-Met inhibitor (PHA, 0.1 μM) or U0126 (25 μM) reversed the HSC-CM- (C) or HGF-mediated (F, G) alterations of c-Met and ERK1/2 phosphorylation, CyclinD1, cleaved caspase-3, autophagic protein (LC3-II, P62, ATG5 and Beclin1). ATG5- (H) or Beclin1-knockdown (I) suppressed heat-treated (47 °C for 10 min) residual HCC cells under ischemic (1% FBS) condition in response to HGF (0, 2, 10 ng/mL), as indicated by the alterations of LC3-II, P62, cleaved caspase-3 and bcl-2.
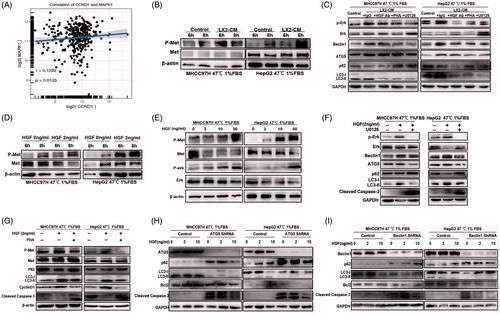
Figure 6. Incomplete RFA induced autophagy in residual HCC in an orthotopic HCC model. The mRNA expression (A) of ATG5, ATG7, Beclin1, LC3B, P62 and protein expression (B) of LC3B, P62 were assessed in residual HCC tissues after incomplete RFA. (C) AVs (red arrows) in the tissue sections of post-RFA residual HCC were detected by electron microscopy. (D) Immunohistochemical staining for LC3B, P62, ATG5, Ki-67, α-SMA, HGF, phosphorylated c-Met and phosphorylated ERK1/2 in residual HCC foci after incomplete RFA. Accumulation of activated HSCs (α-SMA, a marker of activated HSCs) surrounded the residual HCC foci. **, p < .01; *, p < .05, bar = 1 mm.
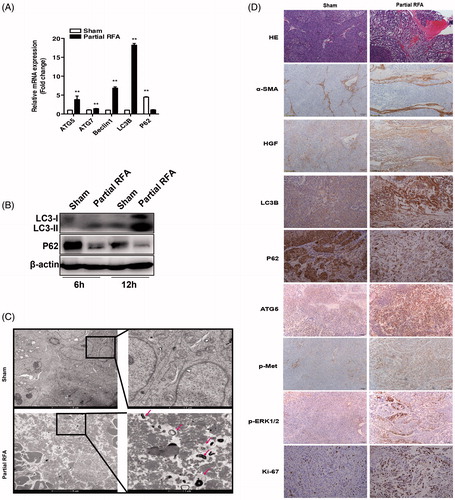
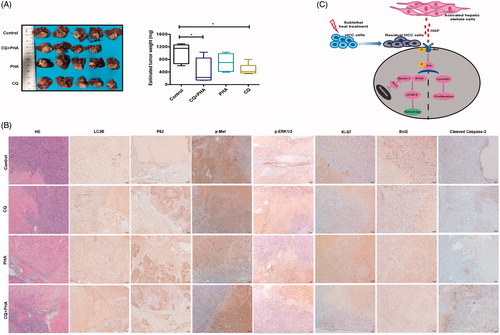
Figure 7. A combination of autophagy inhibitor CQ and c-Met inhibitor (PHA) suppressed tumor progression of residual HCC after incomplete RFA. (A) Tumor size of residual HCC after incomplete RFA was significantly smaller in combined treatment (CQ + PHA) group than that in the other groups (control, CQ, or PHA treatment), except one mouse in combined treatment group died on day 1 after RFA due to intestinal perforation. The box-plots indicate quantification. (B) CQ combined with PHA significantly suppressed autophagy (increased LC3B and P62 expression), ERK1/2 and c-Met phosphorylation and proliferation (decreased Ki-67 expression), and increased apoptosis (low Blc-2 and high cleaved caspases-3) in residual HCC tissues after incomplete RFA. (C) A schematic diagram of activated HSCs promoting tumor progression of heat-treated residual surviving HCC from autophagic survival to proliferation via HGF/c-Met signaling. **, p < .01; *, p < .05, bar = 50 μm/1 mm.