Figures & data
Figure 1. Chemical structure of oleic acid (OA), polysorbate-80 (P-80) and stevioside (STE).
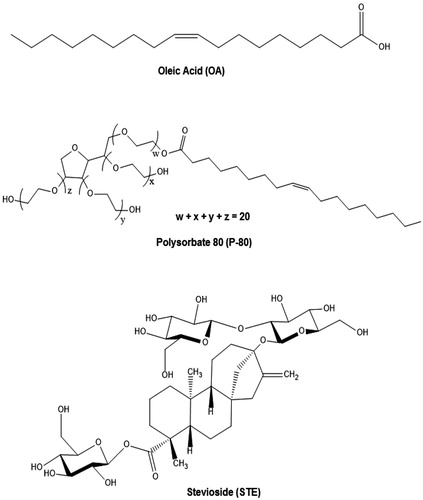
Figure 2. The XRD diffraction pattern of bare Fe3O4, OA-Fe3O4, P-80-Fe3O4 and STE-Fe3O4 (1.0 g and 0.5 g).
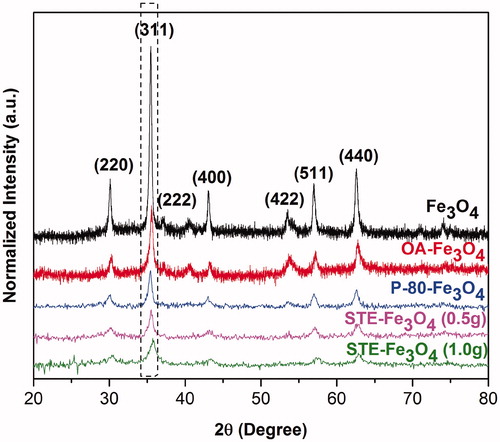
Figure 3. (A) Hydrodynamic size measurements of MNPs. (B–F) TEM image analysis and size distribution histograms of (B) Fe3O4, (C) P-80-Fe3O4, (D) OA-Fe3O4, (E) STE-Fe3O4 (0.5 g) and (F) STE-Fe3O4 (1.0 g). Dm represents the mean diameter and σ represents the standard deviation of the nanoparticles.
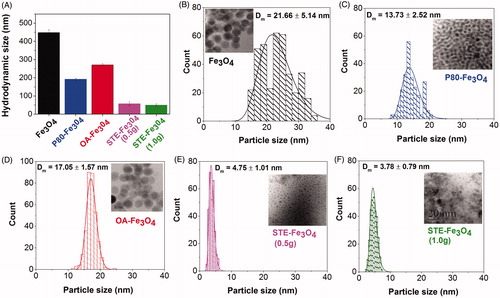
Figure 4. Magnetic measurements of iron oxide nanoparticles. (A) Magnetization versus magnetic field measured at 300 K and 5 K, (B) Coercivity as a function of particle size at 300 K and 5 K.
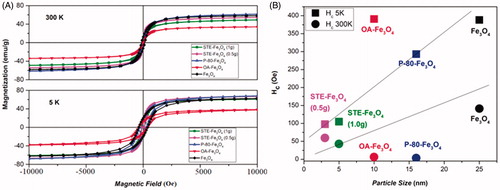
Figure 5. Prussian blue staining of C6 glioma cells indicating cellular uptake by C6 glioma cells at (A) 6 and (B) 12 h, respectively for control, bare and coated nanosystems (Scale bar = 100 μm).
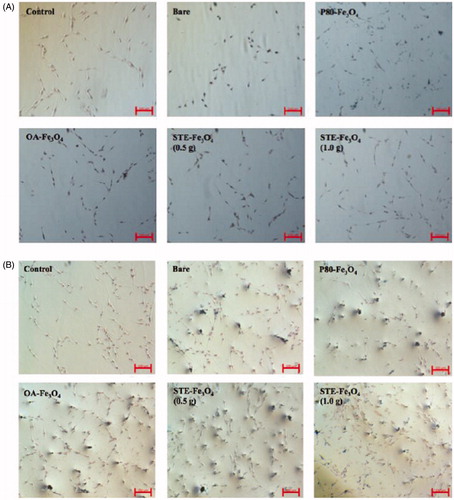
Figure 6. Quantitative analysis of MNP uptake by C6 glioma cells by ICP-AES after 6 and 12 h of treatment with the nanoparticles.
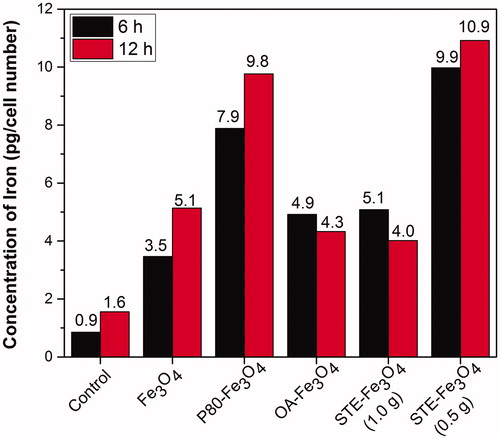
Figure 7. Confocal microscopy of C6 glioma cells to determine sub-cellular localization of nanoparticles in C6 cells (Scale bar = 10 μm). In the figure, nuclei are stained with Hoescht-3342, lysosomes with Lysotracker Red, and MNPs are represented by FITC channel. Arrows indicate sub-cellular localisation of FITC-conjugated MNPs in cells.
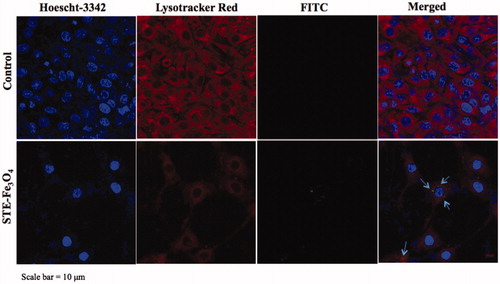
Figure 8. Prussian blue staining of C6 glioma cells indicating cellular persistence of control (no MNP added), bare and STE-coated MNPs (0.5 g) by C6 glioma cells, post-incubation with MNPs after 24 h and 48 h, respectively.
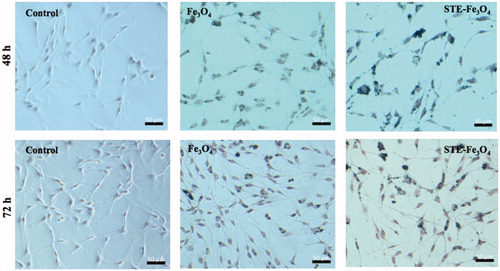
Figure 9. (A) The temperature change for Fe3O4 nanoparticles coated with P-80, OA, STE and bare Fe3O4 nanoparticles at a concentration of 1 mg/mL on application of AMF of strength 168 Gauss at f = 405 kHz for 20 min. (B) Total temperature change achieved for the nanosystems achieved and their corresponding SAR values (C). The shaded region represents the desired hyperthermia temperature window for the therapeutic effect.
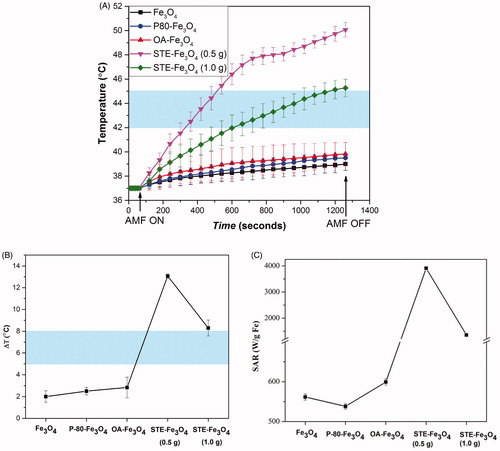
Figure 10. Effect of frequency of STE-Fe3O4 MNPs (0.5 g) (A) and STE- Fe3O4 MNPs (1.0 g), (B) and effect of MNP concentration on STE- Fe3O4 MNPs (0.5 g), (C) and STE- Fe3O4 MNPs (1.0 g), (D) on thermal behavior of the nanosystems at f = 405 kHz and 168 Oe. The values written on curve C and D represent the total degree rise in temperature for different concentrations tested. The shaded region represents the desired hyperthermia temperature window for therapeutic effect.
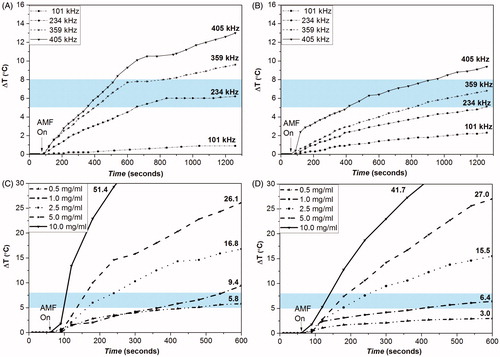
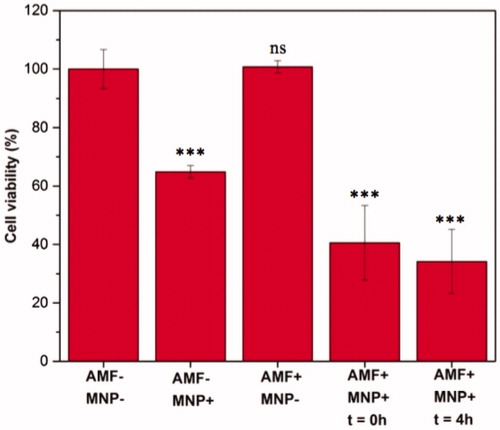
Figure 11. In vitro magnetic hyperthermia experiments on C6 cells. All experiments were conducted in triplicates at AMF of 405 kHz and 168 Oe. The temperature was maintained at 43 °C.