Figures & data
Table 1. Baseline characteristics of the patients.
Table 2. Characteristics of the patients stratified by ALBI grade.
Figure 1. Representative pictures of the patient with ICC after CT-PMWA. (a&b): Pre-PMWA MRI images (A: contrast-enhanced T1WI; B:T2WI); (c&d): Two images of plain CT scan during PMWA procedure show the well location of PMWA electrode probes; (e–g): Post-PMWA MRI images (contrast-enhanced TIWI) at 6-month(e), 1-year(f), and 3-year(g), respectively.
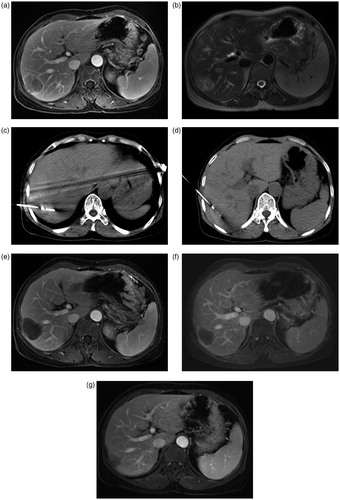
Table 3. Factors associating with the overall survival of patients.
Table 4. Factors associating with the recurrence-free survival of patients.
Figure 2. (A): Graph shows the cumulative 1-, 3- and 5-year overall survival rates of patients with ICCs after CT-guided PMWA treatment based on the Child score. (B): Graph shows the cumulative 1-, 3- and 5-year overall survival rates of patients with ICCs after CT-guided PMWA treatment based on the ALBI grade.
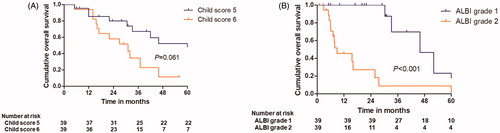
Figure 3. (A): Graph shows the cumulative 1-, 3- and 5-year overall survival rates of patients with a hepatic function of child score 5 after CT-guided PMWA treatment based on the ALBI grade. (B): Graph shows the cumulative 1-, 3- and 5-year overall survival rates of patients with a hepatic function of child score 6 after CT-guided PMWA treatment based on the ALBI grade.
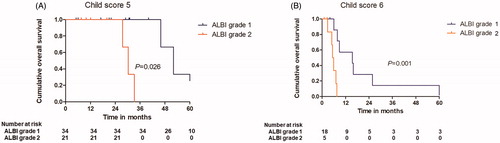
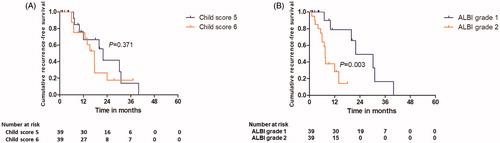
Figure 4. (A): Graph shows the cumulative 1-, 3- and 5-year recurrence-free survival rates of patients with ICCs after CT-guided PMWA treatment based on the child score. (B): Graph shows cumulative 1-, 3- and 5-year recurrence-free survival rates of patients with ICCs after CT-guided PMWA treatment based on the ALBI grade.