Figures & data
Figure 1. (A) The photograph shows the multi-functional perfusion-thermal electrode, with multi-prongs for delivery of oncolytic viruses and thermal energy simultaneously. (B) The RF electrode is positioned in the center of a rat hepatic HCC (open arrow) under ultrasound guidance. (C). Oncolytic viruses are locally delivered into the tumor margin through the infusion prongs (arrows), where RF hyperthermia is simultaneously generated to further enhance the uptake of oncolytic viruses by the HCC (open arrows) cells.
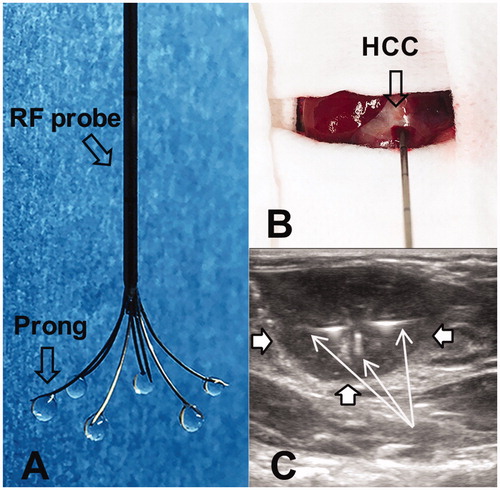
Figure 2. (A) Confocal microscopy shows the lowest number of viable cells in the group treated with combination therapy, compared with other three groups. (B) MTS assay further demonstrates the lowest cell viability in combination therapy group (*p < .001). (C&D) Flow cytometry shows the highest percentage of early apoptotic HCC cells in combination therapy group, compared with other three groups (*p < .001).
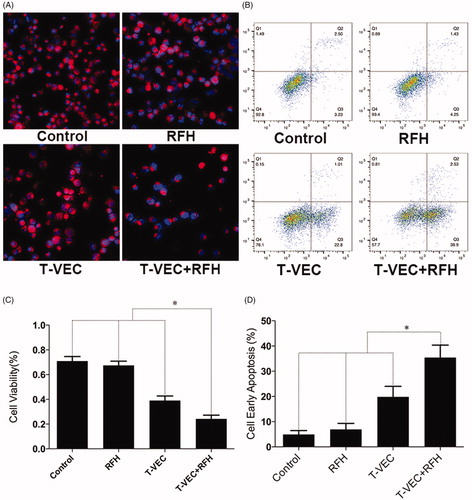
Figure 3. Fluorescent signal intensity is quantified 24 h after the treatments. There is a significant decrease in relative fluorescent signal (golden-yellow color) with combination therapy group, compared to other three treatments (*p < .001).
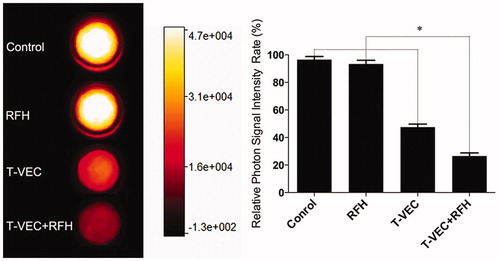
Figure 4. (A&B) Ultrasound imaging is used to follow up the tumor growth (arrows) at days 0, 7 and 14, showing a significant decrease in relative tumor volume with combination therapy compared with other three treatments (n = 6/group, *p < .005). (C&D) Optical/X-ray imaging is used to follow up tumor responses to the treatments at days 0, 7 and 14, demonstrating a significant decrease in both relative fluorescent signal (golden-yellow color) and tumor size with combination therapy compared to other three treatments (n = 6/group, *p < .05).
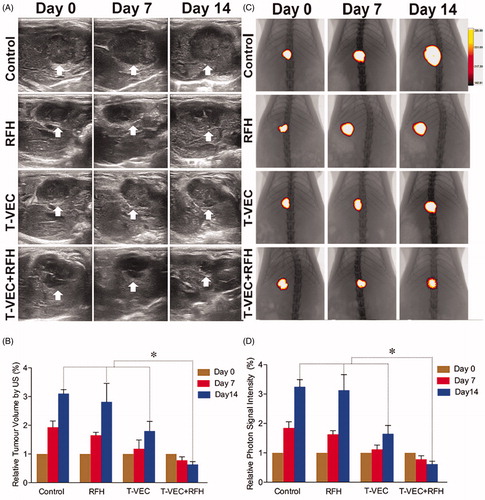
Figure 5. Representative tumors harvested from four different animal groups, demonstrating the smallest tumor size in the combination therapy group (T-VEC + RFH) compared to other three groups (n = 6/group, *p < .05).
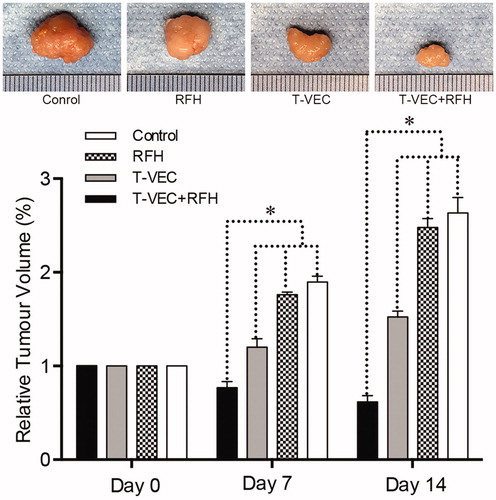
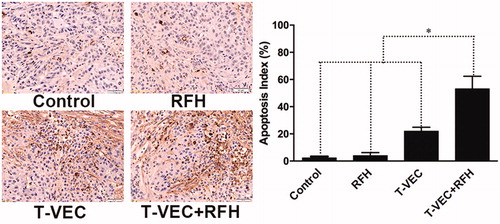
Figure 6. Apoptosis analysis using TUNEL staining further confirms more apoptotic cells (brown dots, 20×) in the combination therapy group than other three groups (n = 6/group, *p < .001).