Figures & data
Figure 1. The mRNA and protein levels of CXCL10 and IL-6 in spleen and serum were determined by RT-PCR and ELISA on day 14 after cryo-thermal therapy. (A and B) (spleen) and (C) (serum). The mRNA and protein levels of CXCL10. (D and E) (spleen) and (F) (serum). The mRNA and protein levels of IL-6. Data were shown as mean ± SD. Data for bar graphs were calculated using one-way ANOVA. **p < .01 and ***p < .001 was considered to be statistically significant compared with the control group, &p < .05 was considered to be statistically significant compared with cryo-thermal group.
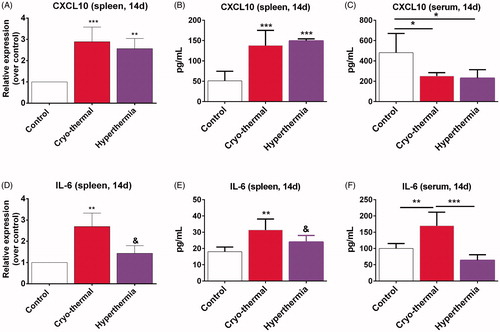
Figure 2. CXCL10 production by splenic macrophages after cryo-thermal therapy promoted DCs migration in vitro. The total migrated cells were counted in CD4+T cells (A), CD8+T cells (B), DCs (C) and MDSCs (D). All data were shown as mean ± SD. *p < .05. Data for bar graphs were calculated using Student’s t-test.
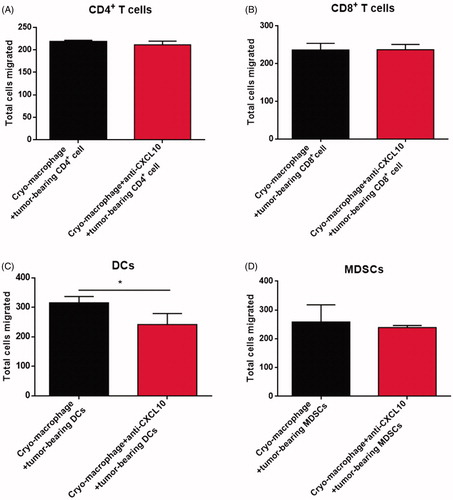
Figure 3. CXCL10 and IL-6 induced by cryo-thermal therapy modulated M1 macrophages polarization. (A and B) On day 14 after the treatment, the splenocytes were harvested from the mice in cryo-thermal + anti-IgG, cryo-thermal + anti-CXCL10, cryo-thermal + anti-IL-6 and the control groups, then the percentage of CD11b+F4/80+CD86+MHC II+ macrophage was analyzed by flow cytometry. All data were shown as mean ± SD. *p < .05. Data for bar graphs were calculated using one-way ANOVA. (C) The mRNA expression level of proinflammatory cytokines in splenic CD68+ macrophages was measured by real-time PCR. (D) The mRNA expression level of immunosuppressive molecules in splenic CD68+ macrophages was measured by real-time PCR. Data were shown as mean ± SD. Data for bar graphs were calculated using two-way ANOVA. Each value of *p < .05 or **p < .01 or ***p < .001 was considered to be statistically significant compared with the control group, &p < .05, &p < .01 and &&&p < .001 was considered to be statistically significant compared with cryo-thermal + anti-IgG group.
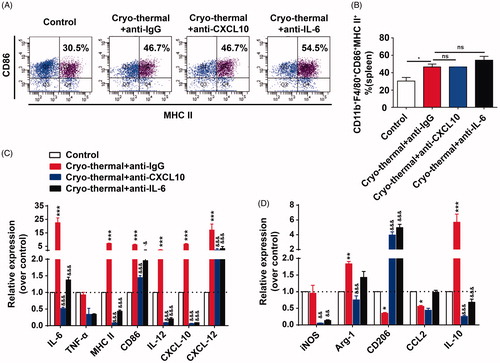
Figure 4. CXCL10 and IL-6 induced by cryo-thermal therapy regulated functional and phenotypic characterization of DCs. (A and B) On day 14 after the treatment, the splenocytes were harvested from the mice in cryo-thermal + anti-IgG, cryo-thermal + anti-CXCL10, cryo-thermal + anti-IL-6 and the control groups, then the percentage of CD11c+CD86+MHC II+ DCs was analyzed by flow cytometry. All data were shown as mean ± SD. *p < .05. Data for bar graphs were calculated using one-way ANOVA. (C) The mRNA expression level of proinflammatory cytokines in splenic CD11c+ cells was measured by real-time PCR. (D) The mRNA expression level of immunosuppressive molecules in splenic CD11c+ cells was measured by real-time PCR. Data were shown as mean ± SD. Data for bar graphs were calculated using two-way ANOVA. Each value of *p < .05 or **p < .01 or ***p < .001 was considered to be statistically significant compared with the control group, &p < .05, &p < .01 and &&&p < .001 was considered to be statistically significant compared with cryo-thermal + anti-IgG group.
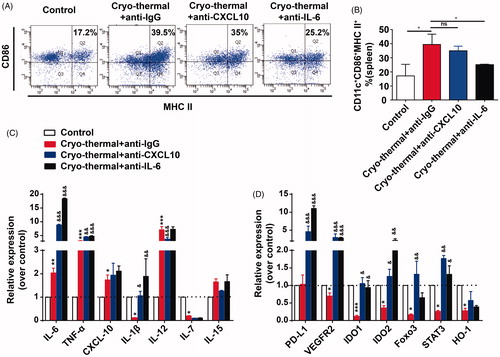
Figure 5. CXCL10 and IL-6 induced by cryo-thermal therapy inhibited MDSCs accumulation in spleen. (A and B) On day 14 after the treatment, the splenocytes were harvested from the mice in cryo-thermal + anti-IgG, cryo-thermal + anti-CXCL10, cryo-thermal + anti-IL-6 and the control groups, then the percentage of MDSCs was analyzed by flow cytometry. All data were shown as mean ± SD. *p < .05. Data for bar graphs were calculated using one-way ANOVA.
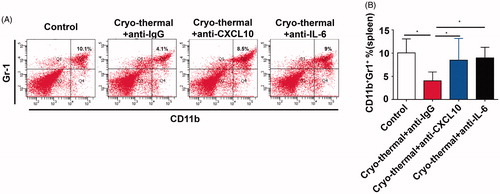
Figure 6. CXCL10 and IL-6 induced by cryo-thermal therapy affected splenic CD4+T cell differentiation. (A and B) On day 14 after the treatment, the splenocytes were harvested from the mice in cryo-thermal + anti-IgG, cryo-thermal + anti-CXCL10, cryo-thermal + anti-IL-6 and the control groups, then the percentage of CD3+CD4+ T cells was analyzed by flow cytometry. All data were shown as mean ± SD. *p < .05. Data for bar graphs were calculated using one-way ANOVA. (C–H) The mRNA expression level of transcription factors and cytokines in splenic CD4+T cells was measured by real-time PCR. Data were shown as mean ± SD. Data for bar graphs were calculated using two-way ANOVA. Each value of *p < .05 or **p < .01 or ***p < .001 was considered to be statistically significant compared with the control group, &p < .05, &p < .01 and &&&p < .001 was considered to be statistically significant compared with cryo-thermal + anti-IgG group.
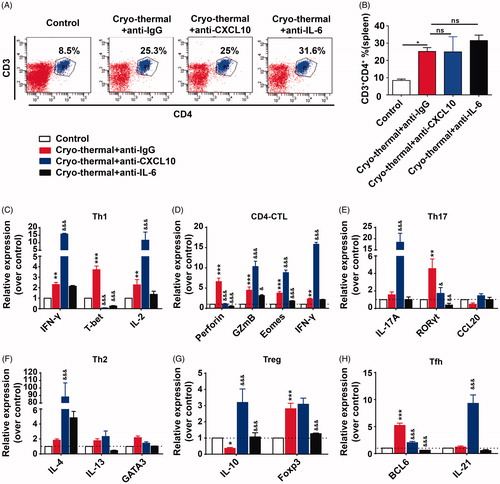
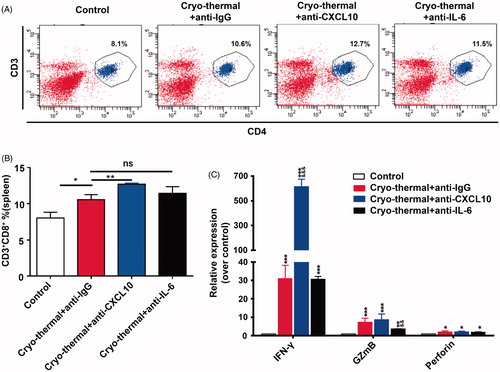
Figure 7. CXCL10 and IL-6 induced by cryo-thermal therapy modulated functional phenotype of CD8+T cells. (A and B) On day 14 after the treatment, the splenocytes were harvested from the mice in cryo-thermal + anti-IgG, cryo-thermal + anti-CXCL10, cryo-thermal + anti-IL-6 and the control groups, then the percentage of CD3+CD8+ T cells was analyzed by flow cytometry. All data were shown as mean ± SD. *p < .05 or **p < .01. Data for bar graphs were calculated using one-way ANOVA. (C) The mRNA expression level of cytotoxic cytokines in splenic CD8+T cells was measured by real-time PCR. Data were shown as mean ± SD. Data for bar graphs were calculated using two-way ANOVA. Each value of *p < .05 or **p < .01 or ***p < .001 was considered to be statistically significant compared with the control group, &p < .05, &p < .01 and &&&p < .001 was considered to be statistically significant compared with cryo-thermal + anti-IgG group.