Figures & data
Figure 1. Schematic work-flow of the adopted methodology.
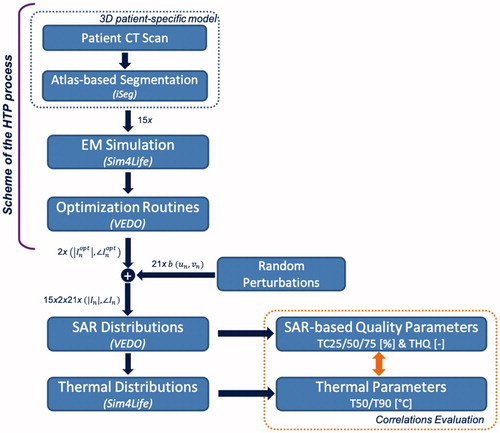
Table 1. Electromagnetic and thermal tissue parameters at 434 MHz accordingly to Verhaart et al. [Citation22].
Table 2. Correlation coefficient (R2) with the median temperature T50 on a per-patient basis.
Table 3. Correlation coefficient (R2) with the median temperature T90 on a per-patient basis.
Figure 2. Inter-patient correlation of all indicators with T50. Each indicator is individually plotted. On each subfigure, the SAR indicator name is displayed and the correlation coefficients (R2) are reported.
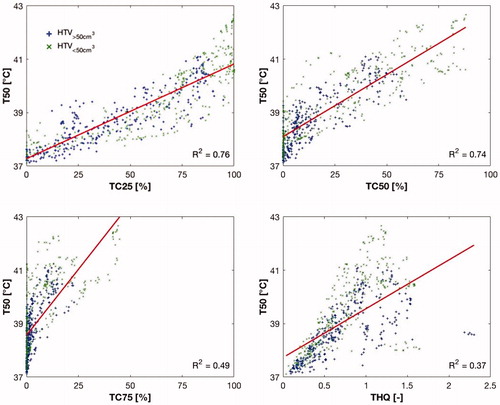
Figure 3. Inter-patient correlation of all indicators with T90. Each indicator is individually plotted. On each subfigure, the SAR indicator name is displayed and the correlation coefficients (R2) are reported.
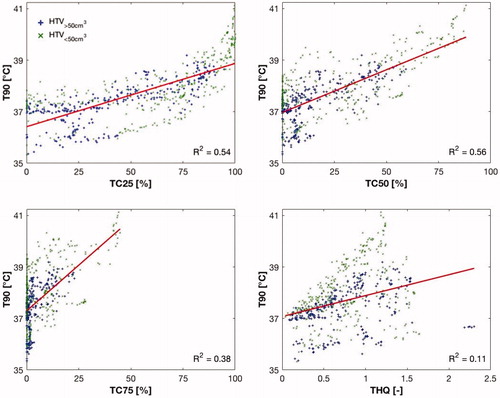
Table 4. Inter-patient correlation coefficient (R2) with T50 and T90 for all patients and separately for the large and small cases.
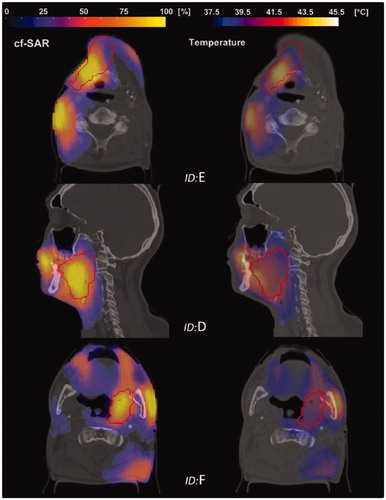
Figure 4. Normalized SAR distribution (left column) and corresponding temperature distribution (right column) for patients ID E, D and F (1st, 2nd and 3rd row respectively). Undesired heating in the proximity of the skin is mitigated by the effect of the water bolus.