Figures & data
Figure 1. (a) A schematic drawing of the heating/measurement setup. A continuous wave thulium laser (‘Tm-Laser’) is guided via an optical fiber (core diameter of 365 µm, NA of 0.2), and a plano-convex quartz lens is located below the cell culture dish. A self-developed Q-switched holmium laser (‘Ho-Laser’) served as probe laser to measure TOA. The probe beam spot was scanned with a galvo scanner in a line over the whole diameter of the bottom of cell growth area with a frequency of 10 Hz for 10 measurement points (The number from 1 to 10). A shutter was used to start and finish the irradiation, and a mirror combines both laser beams. A hydrophone was located outside the dish wall in order to detect the ultrasonic pressure waves after the holmium laser impact. Ultrasonic gel was used to enable acoustic coupling. The ultrasonic pressure waves were amplified and digitized. (b) A picture of a cell culture dish with a culture medium (with phenol red) and a hydrophone.
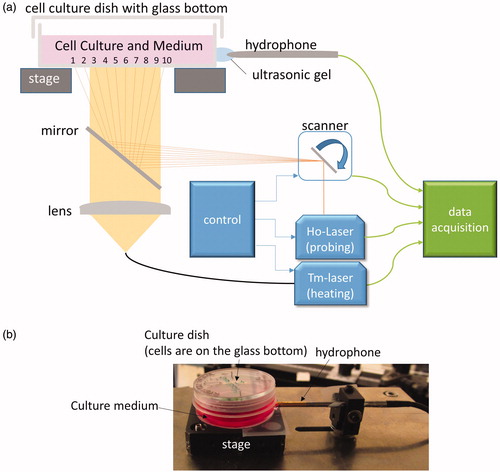
Figure 2. The temperature, measured by a thermocouple (reference temperature, blue line), and the simultaneously obtained (black solid line, standard deviation with black dash lines) of the culture medium during cooling from about 52 °C to 35 °C.
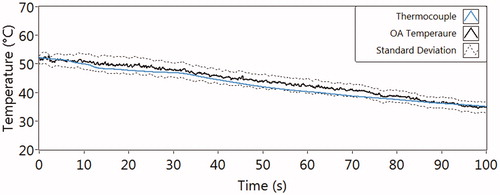
Figure 3. Optoacoustic temperatures (TOA) at each position on RPE cell culture over time during laser heating, with the laser power of 0W (only probe laser) (a), 2 W (b), and 6.8 W (c). About 3 s after the probe laser and the scanner were started, the heating laser was turned on followed by the 10-s irradiation (‘Heat exposure’). The temperature measurements (10 Hz) were continued until 30 s. The temperature course of each measurement point is plotted with different colors and styles.
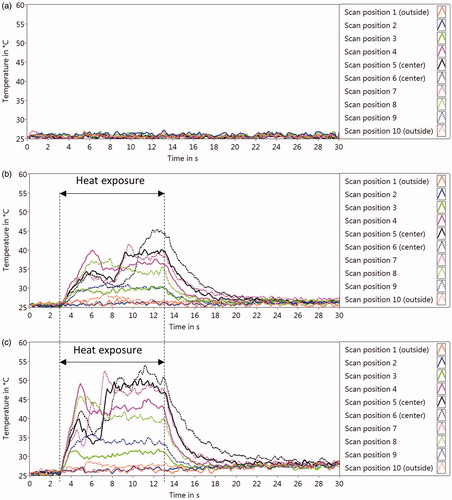
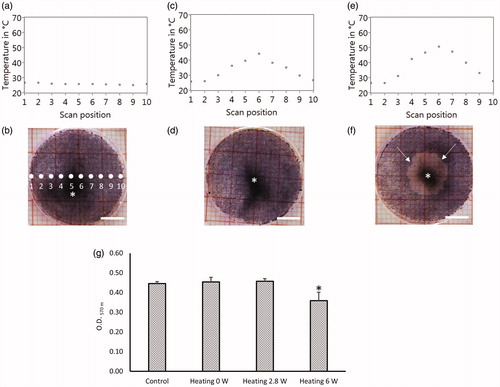
Figure 4. TOA-distribution across the culture dish bottom at the 10th second of irradiation (a, c, e), and the results of MTT assay (cell viability test) for corresponding cell cultures (b, d, f), with the heating laser power of 0W (only probe laser) (a, b), 2 W (c, d), and 6.8 W (e, f). The pictures (b, d, f) are the digital photography images of the cell culture with formazan before lysed. Asterisk (*) shows the inhomogeneous melanin pigmentation. Arrows in (f) indicate the boundary between live and dead cells. (g) The quantification of formazan of the cell lysis by measuring the light absorption at 570 nm. Bar = 5 mm.