
Figures & data
Figure 1. (A) Axial post-contrast fat saturated images following MRgFUS of desmoid tumors of the thigh in two separate patients. In the image on the left, there is persistent patchy enhancement following the treatment, consistent with a residual viable tumor. (B) In contrast, the image on the right from a different patient demonstrates only a thin peripheral rim of enhancement, compatible with a successful large volume ablation (>95%).
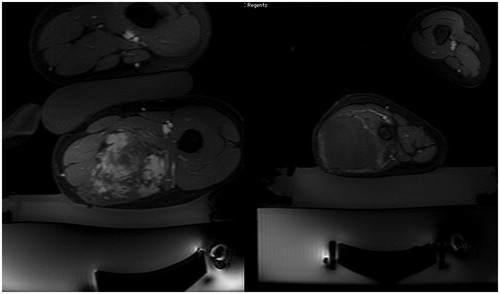
Figure 2. (A) The schematic on the left demonstrates the orientation of sub-sonications during a nominal sonication, with sub-sonications centered around a single point perpendicular to the direction of the sound beam, at varying degrees of spacing (0: least spacing, 4: most spacing). (B) In contrast, the axial T2-fat saturated image on the right demonstrates stacking of multiple sub-sonications (small yellow rectangles) along the direction of the beam path, which is used for elongated sonications. Beam path trajectory showed by the yellow triangle.
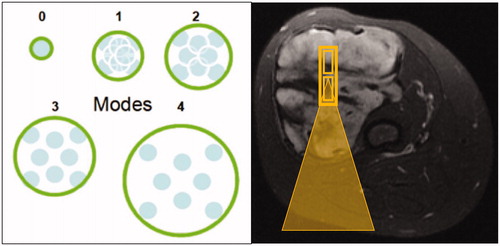
Table 1. Overview of sonication parameter data sorted by sonication type.
Table 2. Variability in thermal dose with regard to sonication technical parameters, calculated by linear and mixed effects models.