Figures & data
Figure 1. Representative images of uterine fibroids with different signal intensities on T2-weighted sagittal MRI. (A) Hypo-intense; (B) Isointense; (C) Heterogeneous intense and (D) Homogeneous hyper-intense. The yellow marker is the outline of the uterine fibroid.
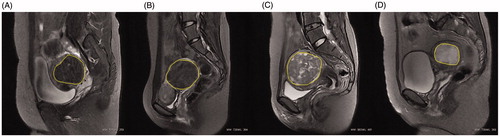
Figure 2. Necrosis of in vitro uterine fibroid specimen (TTC staining): white area depicts necrosis.
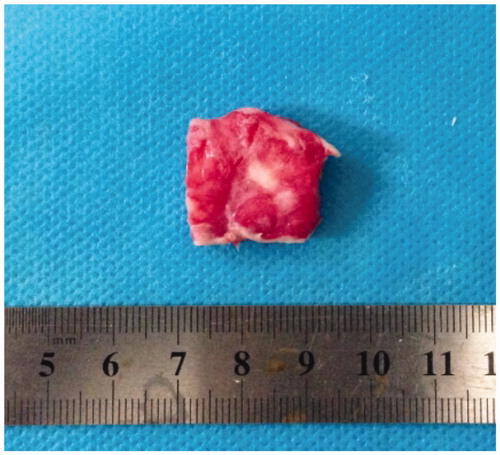
Figure 3. SMC count. Histopathological images with hematoxylin and eosin staining of uterine fibroids, microscopic magnification, ×400. Image-Proplus analysis software automatically identified the nucleus (the nucleus of SMC is shown in dark red) and the cellular count was 243 in the field.
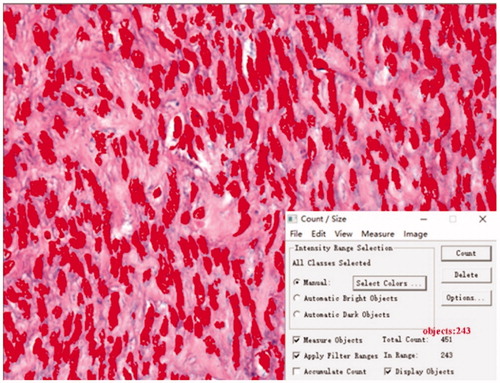
Figure 4. Collagen fiber content on the Sirius red staining image: microscopic magnification, × 400. Photoshop analysis software analyzed the image pixels. (A) pixels of the whole picture and (B) pixels of the red collagen fiber. Collagen fiber content was evaluated as the ratio of the area of red collagen fibers to the total area of image.
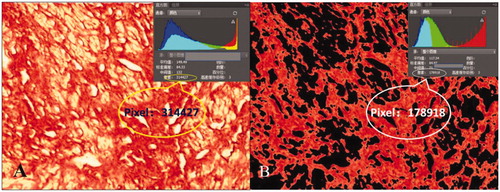
Table 1. Baseline data of patients.
Figure 5. Comparison of necrotic volume and histopathological characteristics of uterine fibroids with different signal intensities on T2-weighted MRI. (A) Necrotic tissue volume; (B) SMC count and (C) Collagen fiber content. Group 1: hypo-intense; Group 2: isointense; Group 3: heterogeneous intense and Group 4: homogeneous hyper-intense (*p < .05).
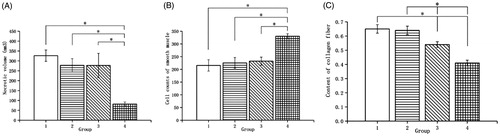
Figure 6. Histopathological images with hematoxylin and eosin staining of uterine fibroids with different signal intensities on T2-weighted MRI. (A) Hypo-intense; (B) Isointense; (C) Heterogeneous intense and (D) Homogeneous hyper-intense. A1–D1: microscopic magnification, × 100; A2–D2: microscopic magnification, × 400.
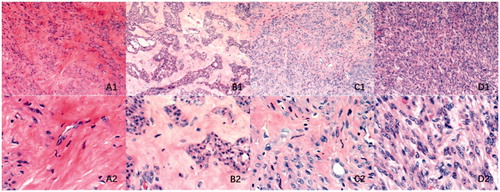
Figure 7. Histopathological images with Sirius red staining of uterine fibroids with different signal intensities on T2-weighted MRI. (A) Hypo-intense; (B) Isointense; (C) Heterogeneous intense and (D) Homogeneous hyper-intense. A1–D1: microscopic magnification, × 100; A2–D2: microscopic magnification, × 400.
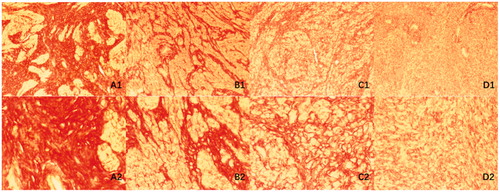
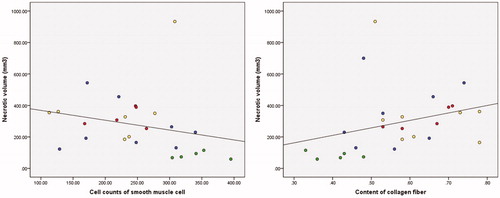
Figure 8. Correlation between necrotic tissue volume and histopathological characteristics. (A) Necrotic volume and SMC count and (B) Necrotic volume and collagen fiber content. Red spots: hypo-intense; yellow spots: isointense; blue spots: heterogeneous intense; green spots: homogeneous hyper-intense.