
Figures & data
Figure 1. Sublethal heat stress induces autophagy in HCC cells. (A, B) SMMC7721 and Huh7 cells were exposed to 37, 43, 45 or 47 °C for 60 min, followed by recovery at 37 °C for 8 h (A), or to 47 °C for 0, 15, 30, 45 or 60 min, followed by recovery at 37 °C for 24 h (B). The expression levels of LC3-II and p62 were analyzed by western blot. LC3-II levels were quantified and normalized to those of β-actin. (C, D) Representative images and quantification results of early autophagosomes in SMMC7721 cells transiently transfected with mRFP-GFP-LC3 adenovirus after exposure to 37, 43, 45 or 47 °C for 60 min and recovery at 37 °C for 8 h. The average numbers of GFP-LC3 and mRFP-LC3 puncta per cell were counted in 6 random fields with at least 100 cells in each group. Scale bar, 20 μm. (E, F) Transmission electron microscopy showed an increased number of autophagic vacuoles in SMMC7721 and Huh7 cells after exposure to 47 °C for 30 min. Typical autophagosomes (arrows); N, nucleus; Scale bar, 2 μm. Each experiment was repeated three times, and representative images are shown. Error bars represent the SEM. ***p < .001.
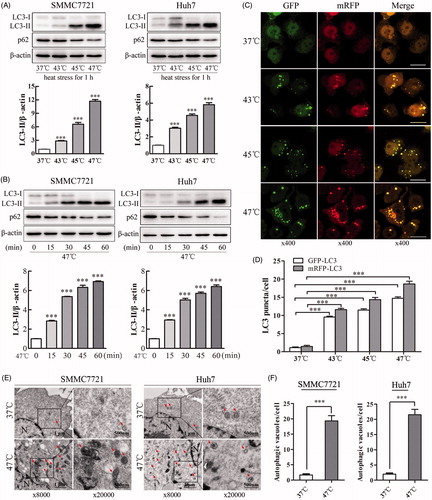
Figure 2. Sublethal heat stress induces autophagic flux in HCC cells. (A, B) SMMC7721 and Huh7 cells were exposed to 47 °C for 30 or 60 min (A) or pretreated with the autophagy inhibitor CQ (20 μM) for 4 h and then exposed to 47 °C for 30 min (B). The expression levels of LC3-II and p62 were analyzed by western blot. p62 levels were quantified and normalized to those of β-actin. (C, D) Representative images and quantification results for LC3 puncta in SMMC7721 and Huh7 cells transiently transfected with mRFP-GFP-LC3 adenovirus followed by exposure to CQ (20 μM) for 4 h and heat treatment at 47 °C for 30 min. Arrows indicate co-localized GFP and mRFP puncta, while arrowheads indicate mRFP puncta. Scale bar, 20 μm. The average numbers of GFP-LC3 and mRFP-LC3 puncta per cell were counted in 6 random fields with at least 100 cells in each group. Each experiment was repeated three times, and representative images are shown. Error bars represent the SEM. **p < .01; ***p < .001.
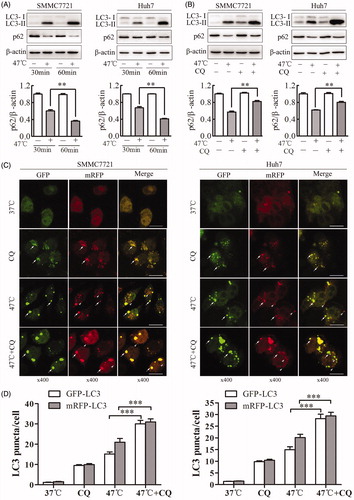
Figure 3. Inhibition of autophagy by CQ markedly suppresses cell proliferation and enhances heat-induced apoptosis in HCC cells. (A) Cell viability was assessed by CCK-8 assays. SMMC7721 and Huh7 cells were pretreated with CQ (20 μM) for 4 h and then exposed to 47 °C for 30 min, followed by culture at 37 °C for 24 h. (B) SMMC7721 cells were pretreated with CQ (20 μM) for 4 h and then exposed to 47 °C for 30 min, followed by culture with EdU at 37 °C for 2 h. Images were taken under a fluorescence microscope. Scale bar, 20 μm. (C, D) SMMC7721 and Huh7 cells were treated as in (A), and apoptosis was analyzed by flow cytometry (C) and western blot (D). Each experiment was repeated three times and representative images are shown. Error bars represent the SEM. **p < .01; ***p < .001.
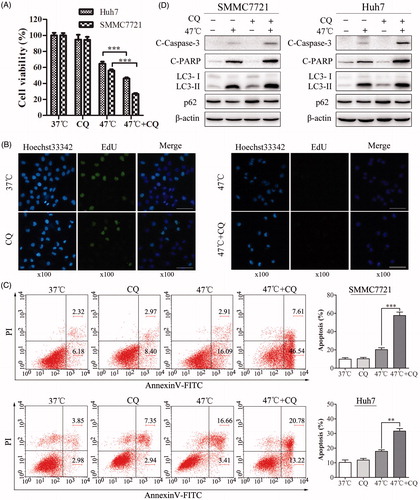
Figure 4. Inhibition of autophagy by Beclin-1 or Atg5 siRNA enhances heat-induced apoptosis in HCC cells. (A) SMMC7721 and Huh7 cells were exposed to 47 °C for 30 min followed by culture at 37 °C for the indicated time. The expression levels of Beclin-1, Atg5, Atg7, LC3-II and p62 were analyzed by western blot. (B) The efficacy of siRNA targeting Beclin-1 and Atg5 was measured by western blot. SMMC7721 and Huh7 cells were transfected with NC siRNA, Beclin-1 siRNA, or Atg5 siRNA for 48 h and then exposed to heat treatment, followed by recovery for 24 h. (C) SMMC7721 and Huh7 cells treated as in (B) were stained with 5 μL of FITC-Annexin V and 1 μL of 100 μg/mL PI working solution for 15 min in the dark. Apoptotic cells were analyzed by flow cytometry within 1 h. Each experiment was repeated three times and representative images are shown. Error bars represent the SEM. ***p < .001.
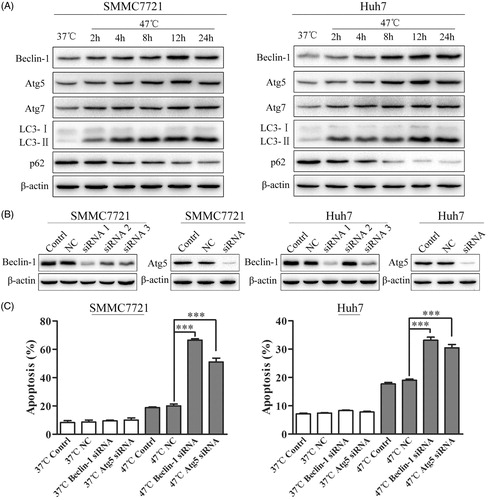
Figure 5. Heat stress induces autophagy through the ATP-AMPK-mTOR signaling pathway. (A) Heat stress decreased ATP in HCC cells after exposure to 47 °C for 30 min and recovery for 24 h. (B) Heat stress activated the AMPK-mTOR signaling pathway in SMMC7721 and Huh7 cells. The levels of AMPK, p-AMPK, mTOR, p-mTOR, p70S6K, p-p70S6K, 4E-BP1 and p-4E-BP1 were analyzed by western blot. SMMC7721 and Huh7 cells were exposed to 47 °C for 30 min, followed by recovery for 24 h. (C, D) The levels of p-AMPK, AMPK, p-mTOR, mTOR, LC3 and p62 were assessed by western blot. SMMC7721 cells were exposed to 47 °C for 30 min, followed by treatment with the AMPK agonist AICAR (1 mM) or the AMPK inhibitor compound C (10 μM) for 24 h. Each experiment was repeated three times, and representative images are shown. Error bars represent the SEM. ***p < .001.
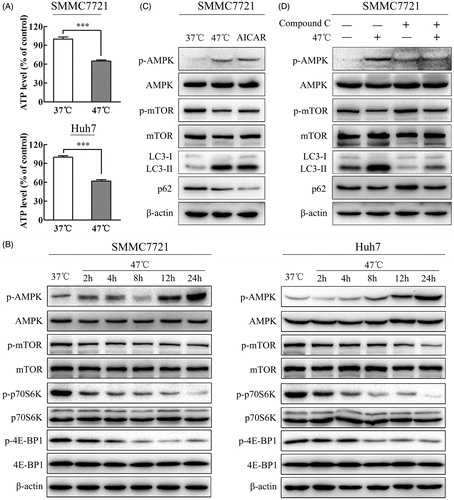
Figure 6. Inhibition of autophagy by CQ significantly enhances the antitumor effects of heat treatment in vivo. (A–D) SMMC7721 cells pretreated at 47 °C for 30 min or maintained at 37 °C were subcutaneously injected into the upper right flank of nude mice, treated with or without CQ and tumor size was measured. Mice were sacrificed 30 d after implantation (A). Tumor growth was measured every 3 d for 30 d, and the results were plotted (B). Tumors were harvested, photographed (C) and weighed, and the results were plotted (D). (E) Representative images of H&E and IHC staining. The levels of LC3, p62, Ki-67 and cleaved Caspase-3 were examined by IHC staining and quantified with Image-Pro Plus software. Scale bar, 100 μm. Each experiment was repeated three times and representative images are shown. Error bars represent the SEM. *p < .05, **p < .01 and ***p < .001.
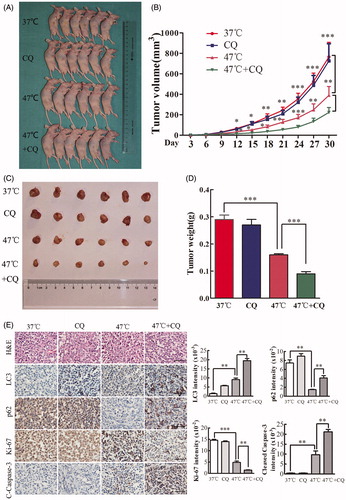
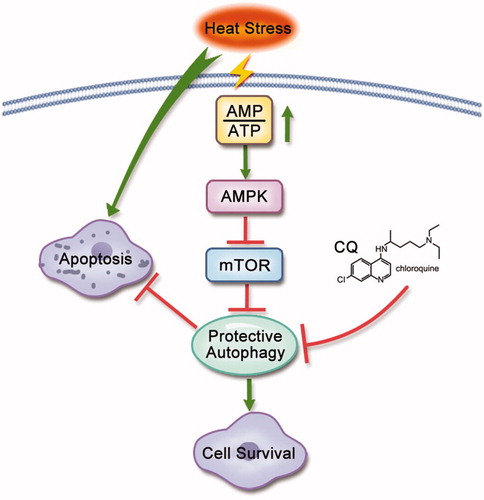
Figure 7. Schematic diagram of the mechanism of heat-induced autophagy that protects HCC cells from heat-induced apoptosis. Under heat treatment, ATP levels decrease, leading to an increase in the AMP/ATP ratio, which directly activates AMPKα by phosphorylation at Thr172 and then inactivates mTOR, leading to autophagy. Autophagy protects against heat treatment-triggered apoptosis. Inhibition of autophagy by CQ can enhance heat-triggered apoptosis. Arrows represent promotion events; blunt arrows indicate suppression events.