Figures & data
Table 1. TMTCP formulation for HIFU experiments.
Figure 1. HIFU systems utilized in TMTCP experiments. (A) The Sonalleve V2 clinical tabletop MR-HIFU system. (B) The TIPS preclinical benchtop US-HIFU system.
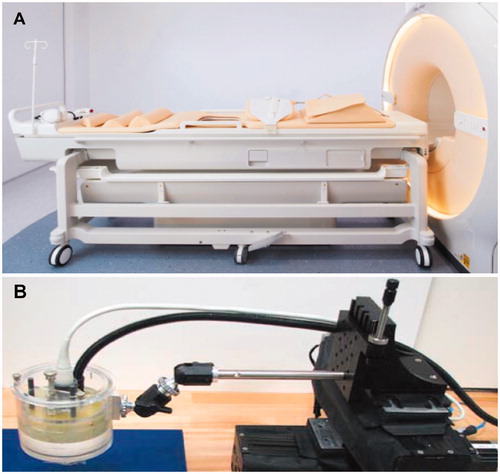
Figure 2. Schematic representation (not depicted to scale) of HIFU targeting in TMTCP using the Sonalleve V2 clinical MR-HIFU system. A similar configuration, but without the MRI coils, was used with the TIPS preclinical US-HIFU system.
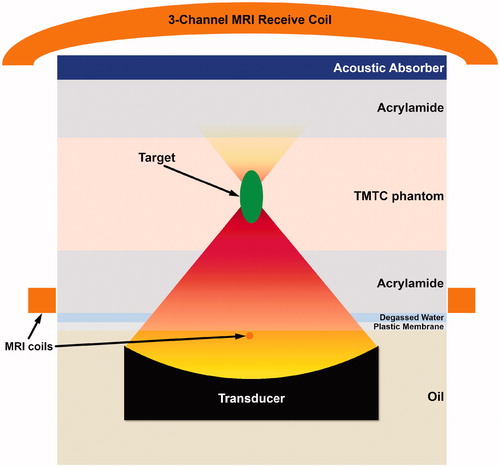
Table 2. Unheated TMTCP properties.
Figure 3. Color of TMTCP samples after water bath heating to temperatures between 30 and 75 °C. Color changes are visible after incubating at temperatures above 45 °C.
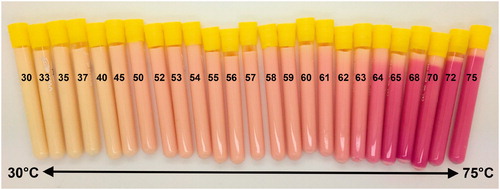
Figure 4. Color vs. temperature calibration curves derived by quantifying RGB-color intensity values of the TMTCP samples as a function of temperature between 30 and 75 °C, overlaid on a computer-generated color swatch. The color swatch aids visual assessment of temperature change in the TMTCP. The circles, squares and triangles represent red, green and blue color channels, respectively. The error bars indicate one standard deviation of intra-phantom or analysis-based variability, not inter-phantom variability.
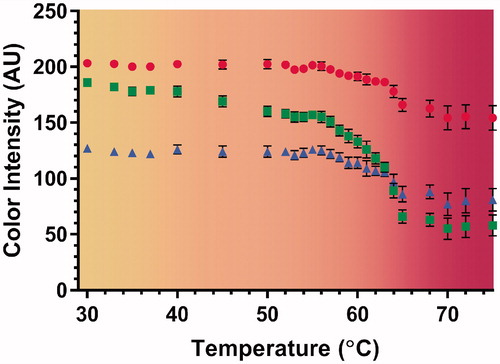
Figure 5. TMTCP color change as a function of temperature (1 °C increments) and phantom formulation: (A) standard formulation, (B) standard formulation without sodium chloride, (C) standard formulation without silica and (D) standard formulation without BSA.
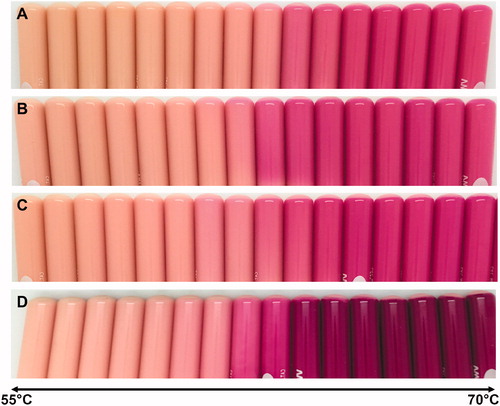
Figure 6. (A) HIFU target planning within a TMTCP performed on T1-weighted MRI. (B) Real-time MRI thermometry during HIFU sonication. (C) Hypointense regions (due to BSA coagulation) on T2-weighted MRI. (D) Photograph of TMTCP cross-section perpendicular to the HIFU beam path, showing permanent color changes with high spatial precision relative to the plan. The dashed line represents the cut to expose volumetric nature of color change. (E) Photograph of a bisected TMTCP showing color changes perpendicular to and along the HIFU beam path.
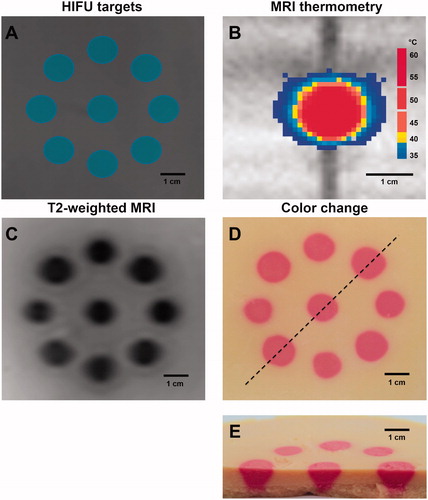
Figure 7. Representative TMTCP cross-section photographs and MRI T2 maps perpendicular to HIFU beam for 60, 120 and 180 s sonications on the TIPS US-HIFU system.
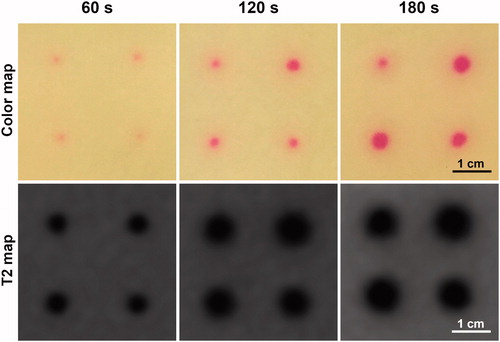
Figure 8. (A&B) Computationally derived T2 and temperature contours based on MRI T2 maps and TMTCP color maps, respectively, following 120 s sonications on the TIPS preclinical HIFU system. (C&D) Representative examples of T2 and color change radial line profiles centered on the target. Profiles correspond to the upper left-hand-corner sonication location in A&B.
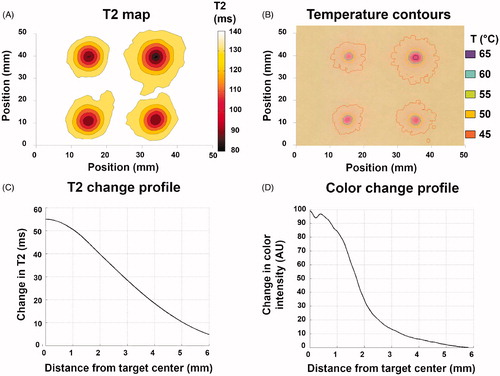
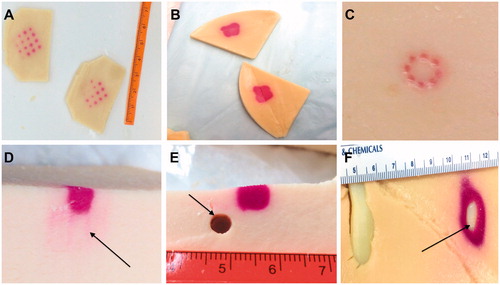
Figure 9. Example applications for TMTCP in HIFU use: (A&B) Assessment of targeting accuracy, sonication grid patterns, sparsity or contiguity of the heated region and achieved temperatures; (C) Assessment of volumetric HIFU histotripsy and the resulting heating; (D) Assessment of side lobes (arrow) and near-field heating; (E) Assessment of heating patterns in close proximity to a vessel mimic (arrow), i.e., a heat sink; and (F) Assessment of heating and heat diffusion in the presence of TMTCP-embedded rib-mimics (arrow).