Figures & data
Figure 1. PRISMA study flowchart.
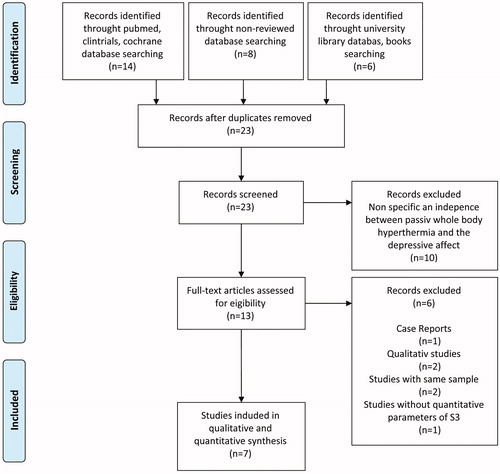
Table 1. Overview of all studies included.
Table 2. Risk of bias analysis for controlled studies.
Table 3. Risk of bias analysis for non-controlled studies.
Table 4. Pre-post treatment effect sizes (Cohen’s d) with 95% confidence intervals, effect sizes >0.80 were considered large, 0.50–0.80 moderate and 0.20–0.50 small.
Figure 2. Relationship between risk of bias (%) and effect sizes from all studies; the bubble size = sample size (n) of studies experimental groups.
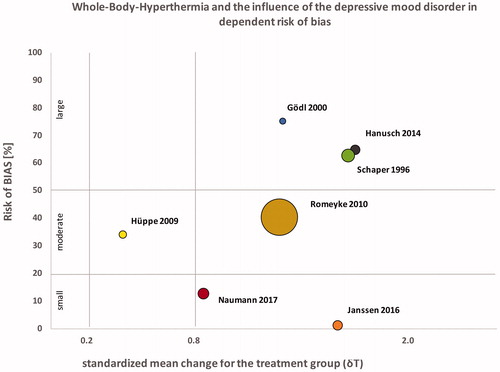
Figure 3. (A) Relationship between core body temperature during the intervention (y-axis) and effect sizes (x-axis) in °Celsius as grouped by measuring method (orange = rectal temperature, green = sublingual temperature, red = ear temperature). (B) Relationship between the ratio of highest core body temperature and time to reach the temperature (y-axis) and effect size (x-axis), grouped by intervention type (orange = infrared heating with IRATHERM device or Heckel device, green = intervention in a bath tub, red = hot tub). (C) Relationship between study end-point (y-axis) and effect size (x-axis) grouped by intervention frequency (green = single session, red = multiple sessions). (D) Relationship between the different methods of measuring core body temperature (x-axis) and core body temperature (y-axis).
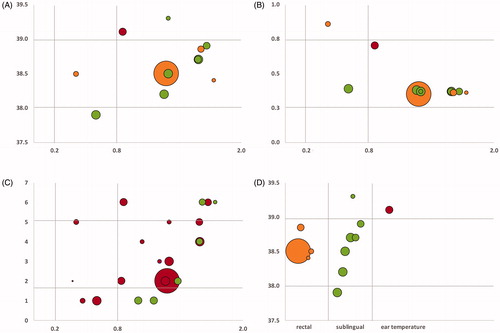
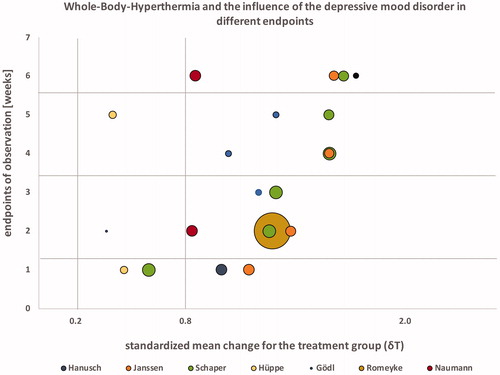
Figure 4. Effect sizes at study end-points (weeks); the bubble size = sample size (n) of studies experimental groups.