Figures & data
Figure 1. MWA experimental setup for validation.
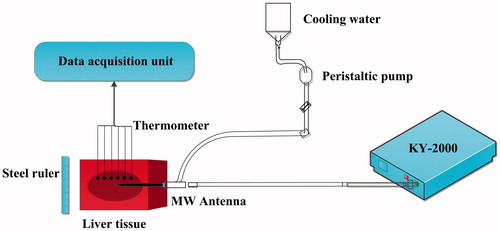
Figure 2. The schematic view of characteristic lengths. is the forward long-axis length,
is the backward long-axis length,
is the short-axis radius,
is the rotation polar-angle,
is the offset polar-angle, and
is the polar radius. The origin is disposed at the MW emission point. The blue line indicates the thermal coagulation zone.
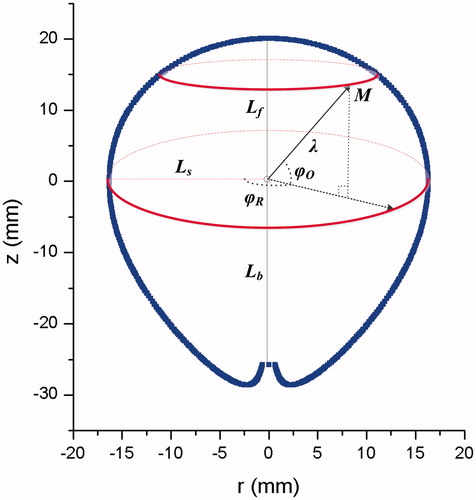
Figure 3. Work flowchart of the conformal coverage algorithm.
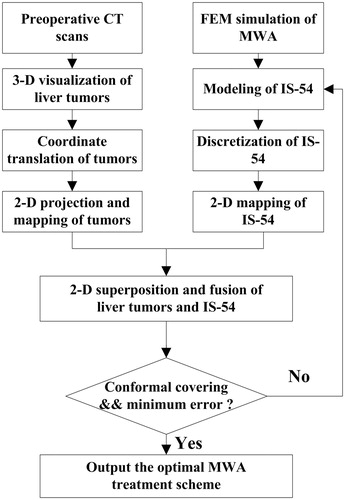
Figure 4. Conformal coverage illustration of liver tumor by IS-54. The blue dots indicate the mesh nodes of the tumor surface. is the forward long-axis length,
is the backward long-axis length,
is the short-axis radius,
is the offset polar-angle,
represents the polar radius of IS-54, and
represents the polar radius of the tumor surface model. The origin is set at the MW emission point.
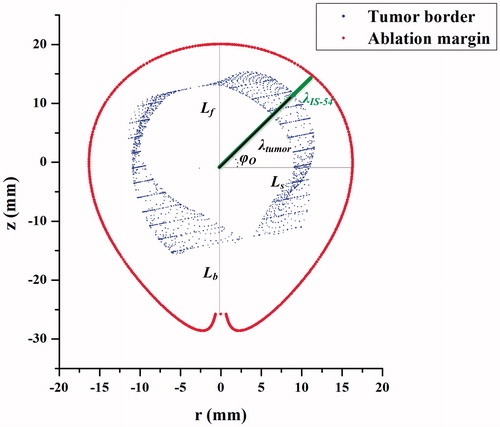
Figure 5. Surface reconstruction results of liver tumors.
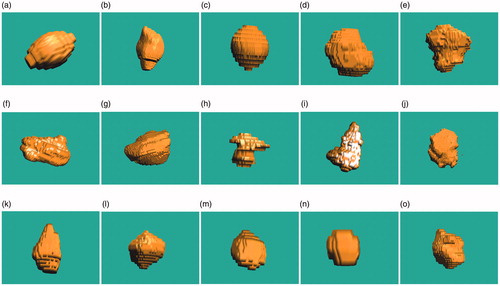
Table 1. Detailed data of tumor reconstruction results.
Figure 6. The temperature comparison plots of the measurements and the simulations at (a) the point V1, (b) the point V2, (c) the point V3, (d) the point V4, (e) the point V5, and (f) the point V6.
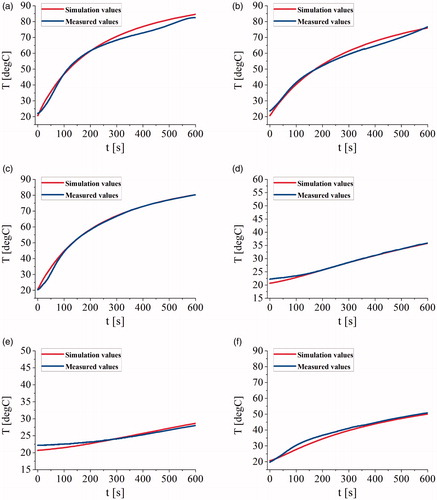
Figure 7. The sectional images of porcine livers after 600 s at 45, 50, and 60 W power levels. IS-54 indicated by the blue line was overlain onto the pathology images of the ablated livers.
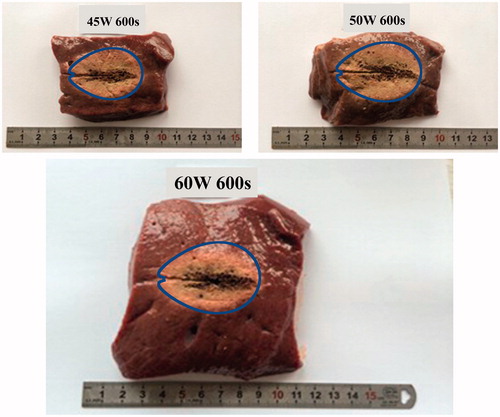
Table 2. Characteristic length growth models at various ablation powers.
Table 3. Corresponding coefficients of IS-54.
Figure 8. R-z projection views of liver tumors. The blue dots indicate the mesh nodes of the tumor surfaces. The gravity centers of the tumors have been placed at the origin.
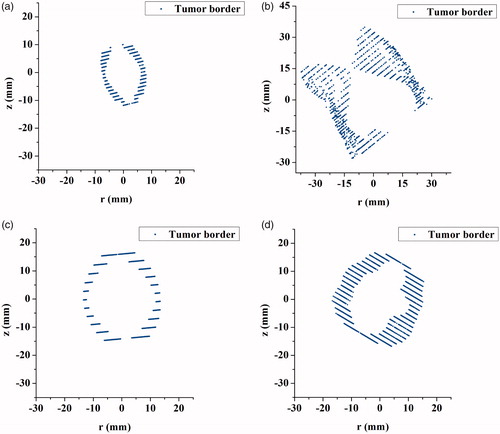
Figure 9. Fusion maps of IS-54 and liver tumors. The red regions represent the backward color maps of IS-54, and the green regions represent the forward color maps of IS-54. The black dots indicate the tumor nodes protruding from IS-54 safety margin.
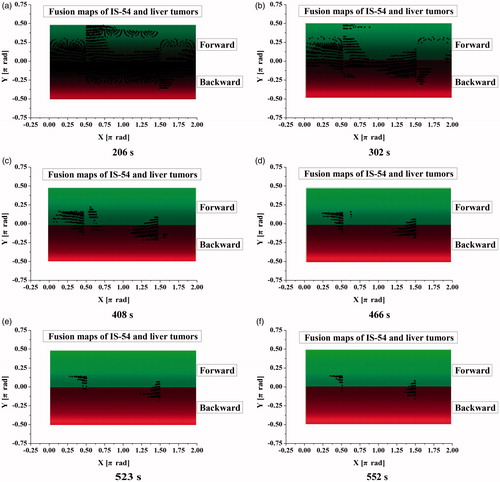
Figure 10. MWA planning interface based on conformal coverage algorithm. The upper-left part of the figure shows the plan projection view of the tumor model and IS-54, the upper-right part shows the fusion map of the tumor model and IS-54, the lower-left part is the selection module of thermal ablation modes and the input module of liver tumor models, and the lower-right part is the output module of optimal treatment parameters.
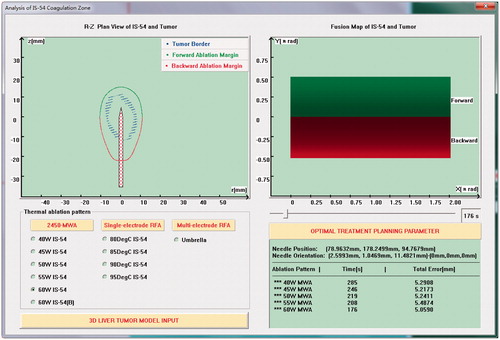
Table 4. Ablation parameters of liver tumors.
Figure 11. The cross-sectional views of liver tumors and MW antenna. The blue lines indicate the insertion positions and orientations of the MW antenna.
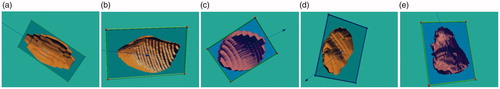
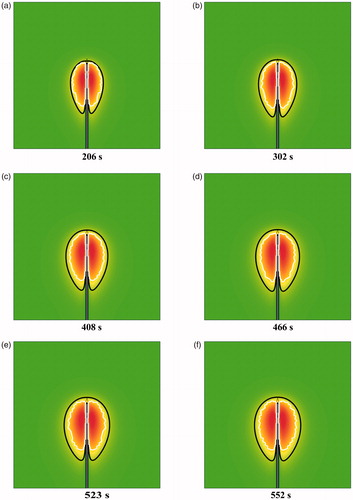
Figure 12. A comparison between the IS-54 and the Arrhenius thermal damage model at (a) 206 s, (b) 302 s, (c) 408 s, (d) 466 s, (e) 523 s, and (f) 552 s. The red region represents the thermal coagulation zone, the black line represents the IS-54 model, and the white line represents the Arrhenius model.
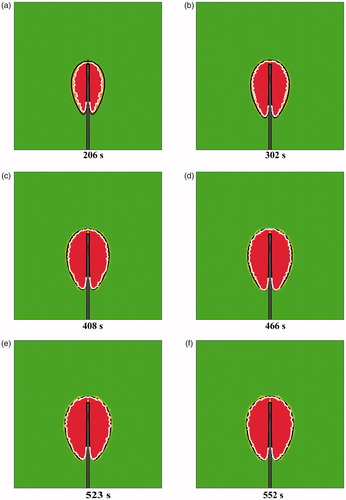
Figure 13. A comparison between the IS-54 and the 240 CEM43 thermal damage model at (a) 206 s, (b) 302 s, (c) 408 s, (d) 466 s, (e) 523 s, and (f) 552 s. The aurantius region represents the thermal coagulation zone, the black line represents the IS-54 model, and the white line represents the 240 CEM43 model.