
Figures & data
Table 1. Summary of ablation parameters studied.
Figure 1. Graphic tracing of a representative course of RF deposition. The tracing demonstrates an initial step-wise increase in energy deposition with periods of cessation of energy deposition following impedance rises. Subsequent step-wise decreases of current are seen when specified energy could not be deposited for 10 s.
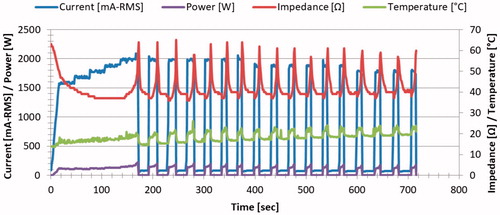
Figure 2. Ex-vivo experimental setup. (A) Generator (white arrow) and plastic basin containing saline solution and liver (red arrow). (B) The liver was partially submerged in the saline bath, with a stand holding the electrode in place.
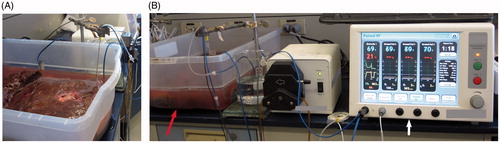
Table 2. Optimal ex-vivo settings providing maximum ablation diameter.
Figure 3. Ex-vivo gross pathology. A representative image of the sectioned liver following a six min RF application using a 3 cm single active tip is presented in transverse (A) and axial section (B). White coagulation measuring 2.7 × 2.7 × 3.3 cm is clearly defined.
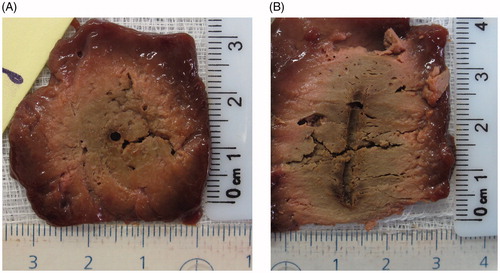
Table 3. Ablation lengths and sphericity index for 12 min ablation duration.
Figure 4. Relationship between maximum electrode temperature immediately after ablation to ablation diameter. A tight correlation to a power function is seen. Colored points represent end temperatures at the optimal settings noted in .
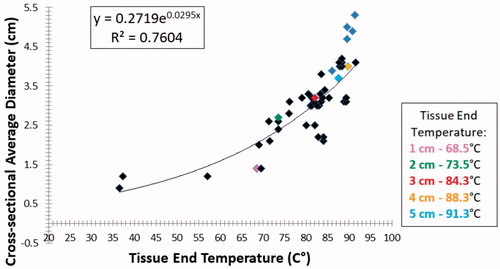
Figure 5. Relationship between ‘heating factor’ and the ablation diameter. Tight correlations to both power and logarithmic functions are seen. Colored points represent end temperatures at the optimal settings as noted.
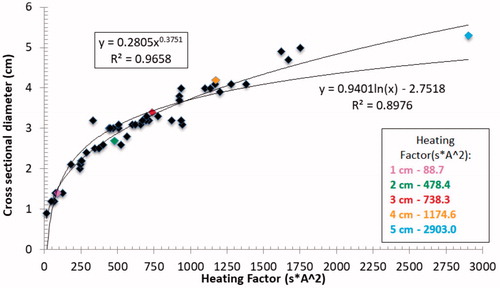
Figure 6. Correlation between initial current output and ablation size. The R2 for the parabolic correlations observed for 2–4 cm electrode tips and 12 min RF ablation are presented. These results denote that there is a range of optimal initial current which provides the maximum coagulation diameter.
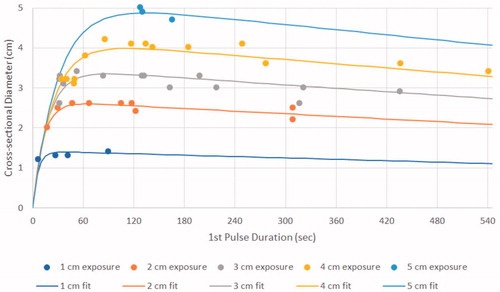
Figure 7. Correlation between the time to first pulse and ablation size. Higher order modeling based upon electrode tip exposure (formula presented in the text) yielded a root mean squared error of 1.9 mm and R2 of 0.95.
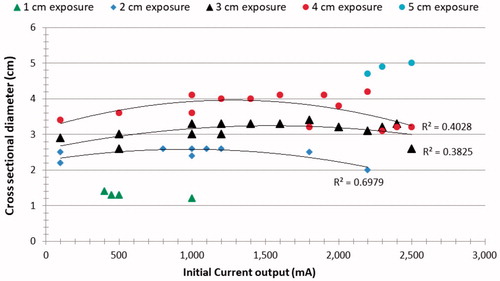
Table 4. Optimized parameters for single-electrode ex vivo data for time to first pulse.