Figures & data
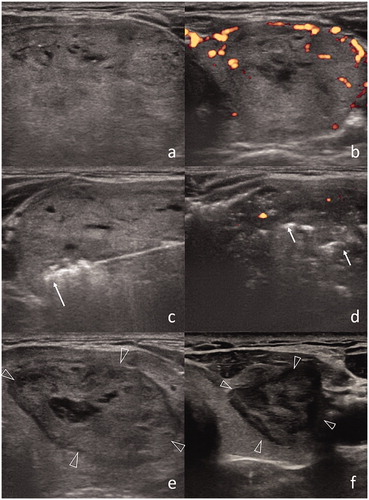
Figure 1. (a) US representation of a benign thyroid nodule. (b) Two laser applicators have been introduced within the nodule, with a distance of ∼5 mm between the needle tips. (c) Gas bubbles in the nodule are the immediate effect of thermal ablation. (d) Immediate post-procedural CEUS shows lack of contrast enhancement in the central part of the nodule. (e) Six-month follow-up shows volumetric reduction of the ablated nodule. (f) CEUS of the ablated nodule shows shrinkage and low vascularization of the inner core of the nodule, due to cicatricial effects.
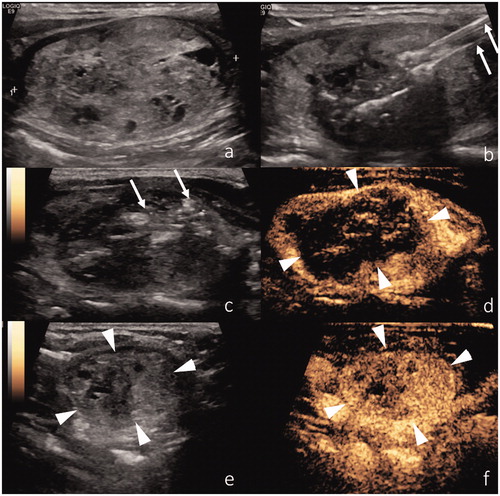
Figure 2. (a,b) US representation of a benign thyroid nodule. (b) Two laser applicators have been introduced within the nodule, with a distance of ∼5 mm between the needle tips (arrows). (c,d) Two needles are introduced in the nodule and gently moved during the procedure according to the pull-back technique (dotted arrows). (e) Air bubbles (arrows) within the ablated nodule (black arrowheads). (f) Post-procedural CEUS confirms lack of contrast enhancement inside the ablated nodule (white arrowheads).
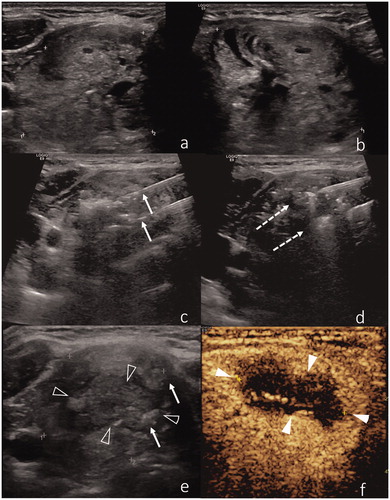
Figure 3. (a) US representation of a benign thyroid nodule (6.4 × 4.0 × 2.8 cm) in the left thyroid lobe. (b) Prominent vascularization is confirmed at Doppler US. (c) RF applicator with 1 cm size active tip is introduced within the nodule (arrow). (d) Post-procedural US shows decreased vascularization in nodule and air bubbles as hyperechoic areas (arrows). (e) After 1 month, the size of nodule is decreased (2.2 × 3.7 × 4.5 cm). (f) Further dimensional reduction after 1 year (1.3 × 1.4 × 2.4 cm).