
Figures & data
Table 1. Baseline characteristics of patients with hepatic hemangiomas ≥5 cm.
Table 2. A comparison of operation data between the MWA and SR procedure groups.
Figure 1. Data concerning three patients in the MWA group with acute kidney injury (AKI). (A) The increased percentage of SCr post-MWA within 48 h. (B) Postoperative recovery time for three patients in the MWA group with AKI.
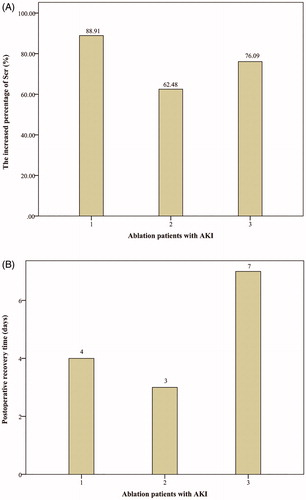
Table 3. The pain/discomfort and complication rates for patients following MWA and SR procedures.
Figure 2. A comparison of the Hgb and Alb values pre- and post-treatment. (*Using an independent t-test, the p value was calculated to evaluate the changes in factors between MWA and SR. The value marked in the picture presents the changes in factors pre- and post-treatment). A, the Hgb value; B, the Alb value.
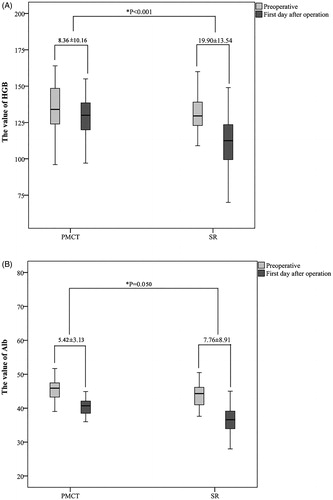
Figure 3. The postoperative change in biochemical parameters concerning liver and renal function (value = mean ± SD). A p value was calculated using a paired-samples t-test. (A) The ALT value (B) The AST value (C) The DB value (D) The SCr value.
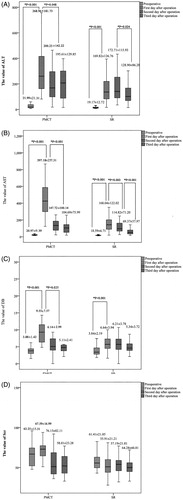
Table 4. Comparing postoperative biochemical parameters between MWA and SR procedures.
Figure 4. An MRI of one patient (n = 1 hemangioma, 6.3 cm in diameter) pre-MWA, one month post-MWA, and 12 months post-MWA. (A) Pre-MWA. (B) One month post-MWA. (C) 12 months post-MWA.
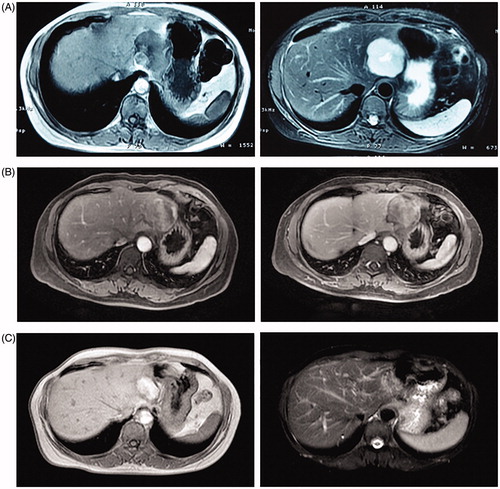
Table 5. A comparison of effectiveness of treatment between MWA and SR procedures.