
Figures & data
Figure 1. Six facial regions for the measurements of facial temperatures and warmth sensitivity. (A) forehead, (B) nose, (C) cheekbone, (D) upper lip, (E) cheek and (F) chin.
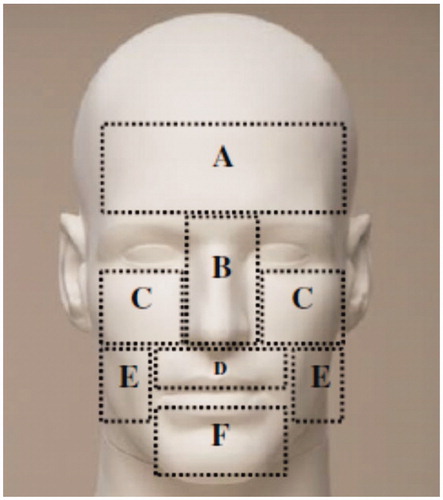
Table 1. Mean temperatures (in °C at 11 min and 30 min of individual trials) during trials at thermoneutral, passive warming and exercise in a warm environment conditions.
Table 2. Heat flux difference pairwise comparisons among the facial regions while adjusting for facial anthropometrics.
Figure 2. Heat flux threshold of six facial regions across thermoneutral, passive warming and exercise conditions. Values are mean and standard deviation (n = 12).
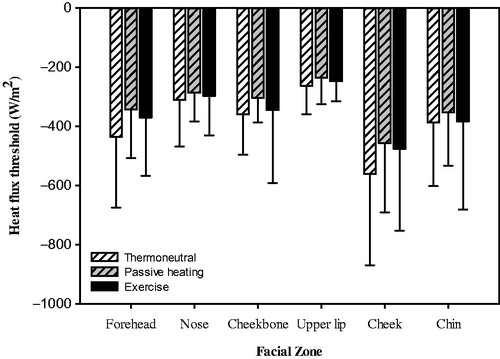
Table 3. Regression model for perceived thermal comfort with physiological measures of face and core body temperatures.