Figures & data
Figure 2. This RNA-based heatmap demonstrates the differences in expression for various gene pathways, following magnetic nanoparticle hyperthermia/mNPH CEM 30 (second column) and a combination of CEM 30 and 8 Gy (first column) as compared to the other treatments including AMF, mNP, AMF + 8 Gy, mNP + 8 Gy and 8 Gy.
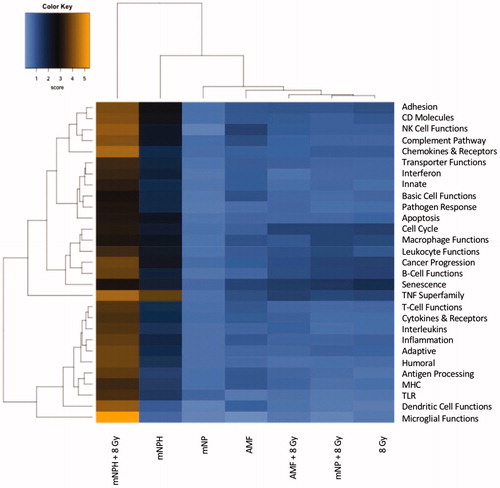
Table 1. This table demonstrates differential RNA-based gene expression, in linear fold change, for various immune and/or cytotoxic relevant genes, as compared to control. Several genes including HSP70, MDM2, Gadd45 and CXCL10, were dramatically altered following low dose (CEM 30) mNPH.
Figure 3. These volcano plots demonstrate differential gene expression fold change following 8 Gy, mNPH or mNPH + 8 Gy, compared to control (on an x-axis log2 scale, with the associated p values). Volcano plots demonstrate gene expression folds changes in two ways: data points moving to the left or right, from the zero point demonstrate positive or negative expression fold change (circles). The higher the data points rest on the y-axis the more statistically significant the change. In this volcano plot, the yellow circles represent those in the cytokine/cytokine receptor pathway. These results suggest that neither 8 Gy nor mNPH alone is a dominant expression promoting factor; rather, the treatments appear to work synergistically together to alter gene expression. The gray circles represent altered genes that not immune or cytotoxicity based. The open circles represent genes who altered expression is not statistically significant at p ≤ .05.
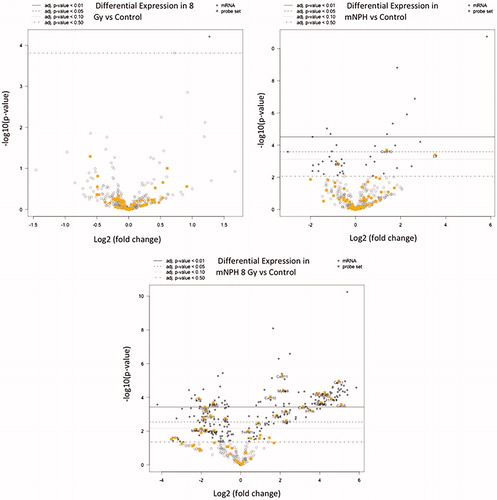
Figure 4. These western/immune blots demonstrate the effect of mNPH CEM 30, 8 Gy and 8 Gy + mNPH had on various protein expression level, with GAPDH as a loading sample. Although mNPH and 8 Gy/mNPH had lower GAPDH than the other conditions, the amount of HSP70 protein was dramatically greater, as was p-mTOR. Additionally, p-MDM2 expression was very significantly decreased following hyperthermia and combinatorial treatments.
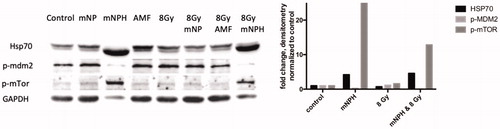
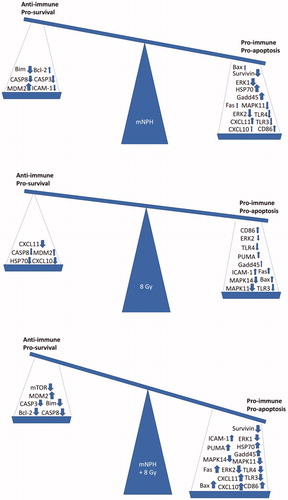
Figure 5. These balances demonstrate the overall effect of the mRNA expression changes for mNPH, 8 Gy and mNPH + 8 Gy as compared to control. The pro-immune/pro-apoptotic versus anti-immune/anti-apoptotic genetic change summary demonstrates the positive effect of mNPH alone, but highlights the much larger effect stimulated by combining mNPH with 8 Gy.