Figures & data
Figure 1. (A) Overview of the catheter-based technique for endoluminal radiofrequency sealing of pancreatic duct. The catheter is introduced into the pancreatic duct through the papilla. (B) Detail of catheter tip in which RF power is applied between two electrodes. The thermal lesion causes the duct to seal (the illustration is that of a human pancreas). (C) 5 Fr bipolar RF catheter used for ex vivo ablations on bovine liver (the most proximal electrodes were used for ablations). (D) 3 Fr bipolar RF catheter used for ex vivo and in vivo ablations on porcine pancreas.
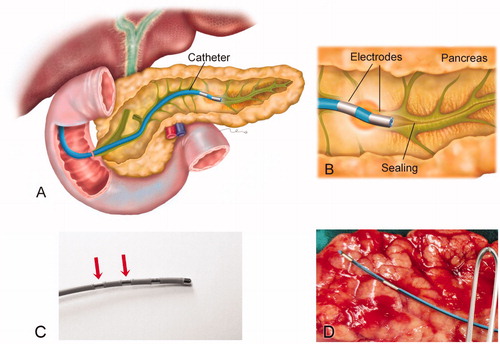
Figure 2. Results of the second set of ex vivo experiments. (A–C) Examples of impedance evolution (A). Small-amplitude sawtooth associated with slow and intermittent catheter pullback; (B and C). Smooth patterns associated with slow and continuous catheter pullback. (D) Thermal lesion created on bovine liver by slow and continuous pullback (impedance shown in B).
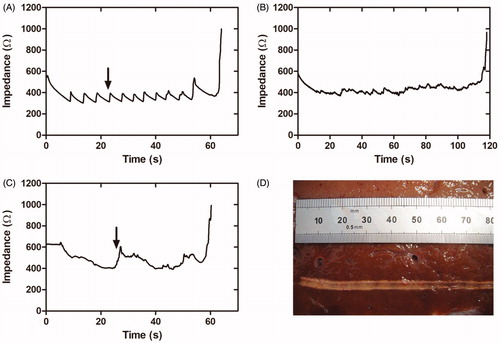
Figure 3. Results of the third set of ex vivo experiments. (A) Typical impedance during ablation. (B) Lesion created along the pancreatic duct in a pancreas treated with 43 V and pullback as continuous as possible. Gray bands show power cut off instants after abrupt impedance increases associated with tissue sticking and carbonization (black arrow in B). After this event pullback was always speeded up in order to relocate the catheter, which in turn led to some visible gaps (white arrow in B).
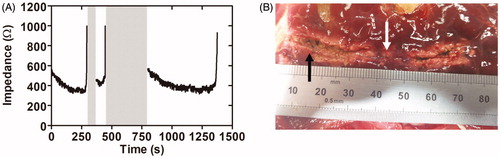
Figure 4. Results of the in vivo experiments. Macroscopic images of one of the treated pancreas and cross sections at the level of the head (A) and body (B). Red circles indicate the position of the main duct. Lumen was not completely closed in all cases and ductal dilation was observed, particularly in the body (units in cm). Gray dashed line indicates the main duct position in pancreas.
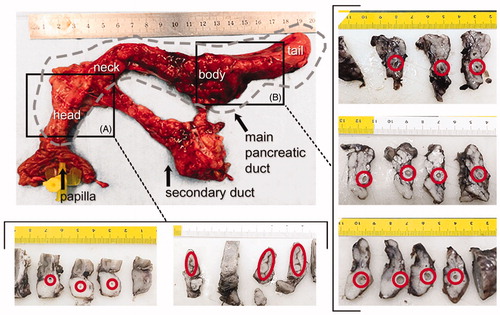
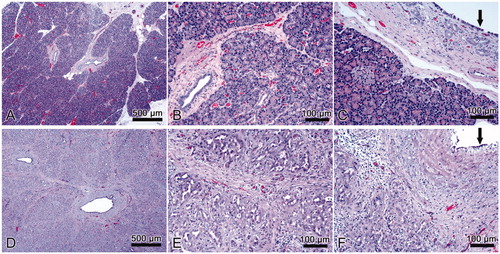
Figure 5. Results of in vivo experiment. Histological images of normal pancreas (A, B, C) and samples with sealing-induced pancreatic atrophy (D, E, F). Compared to normal pancreatic tissue, the treated samples show evident atrophy of the acinar component (purple dye) with only intralobular ducts remaining (D, E); the epithelium of the interlobular ducts is flattened or has been lost (F, black arrow); marked interlobular fibrosis (D, E; F); scattered inflammatory infiltrate (E, F). H&E × 5 (A, D) and ×20 (B, C, E, F).