Figures & data
Figure 1. Illustration of combined motion-assisted/gated HIFU treatment. Motion-assisted/gated HIFU treatment follows the same steps as conventional MRHIFU with a planning and therapy delivery phase. As part of the planning, a 4D-MRI set to characterize the target motion is acquired and is then used to generate an optimized plan that takes into account this target motion. More details on this optimization are provided in . In the treatment phase, the system delivers motion-assisted sonications by applying power throughout the respiratory cycle, or gated sonications by limiting energy delivery to end expiration.
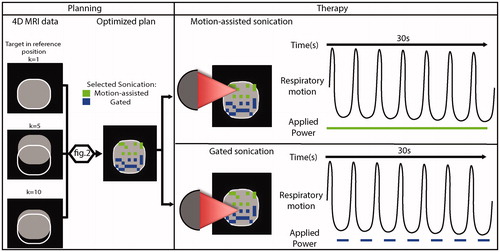
Figure 2. Illustration of the combined motion-assisted/gated sonication planning approach and its four main steps.
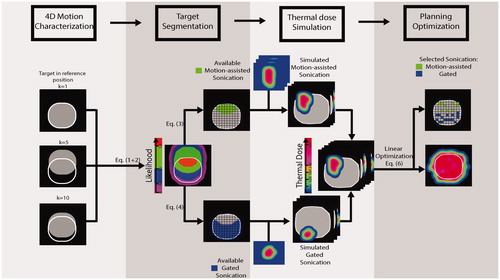
Figure 3. (a) Typical example of acquired 4D images and likelihood map. A red referenced line positioned at the boundary of the organ in the reference phase are there to help the reader to visualize the motion of the target. The color overlaid represents the likelihood map P(x,y,z) in Ω, while the contour of the target in the reference phase is represented with a white contour. (b) Average displacement per ROI measured in all volunteer in the three main direction (antero-posterior, left-right and caudo-cranial).
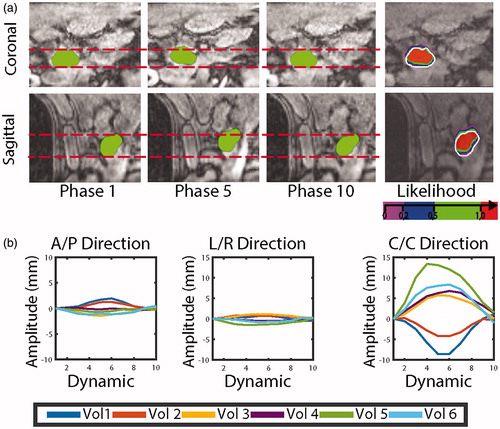
Figure 4. Likelihood P(x,y,z) overlay in Ω on the reference image in all our volunteer. A single slice through the coronal and sagittal orientations are represented for all volunteers, while the contour of the target in the reference phase is represented with a white contour.
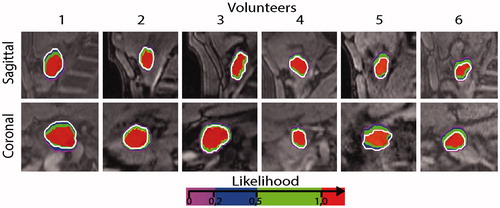
Figure 5. Typical example showcasing the linear optimization step. Single slices in the three orientations are showing, from left to right: all simulated locations (i.e., Cs and Gs), the maximum thermal dose associated with all these locations, the optimized points selected by our algorithm and its associated thermal dose. The contour of the target in the reference phase is represented with a white contour and as an indication a margin contour at 3 mm of the target is indicated in green. Blue and green voxel are locations where gated and motion-assisted sonication can be achieved, respectively.
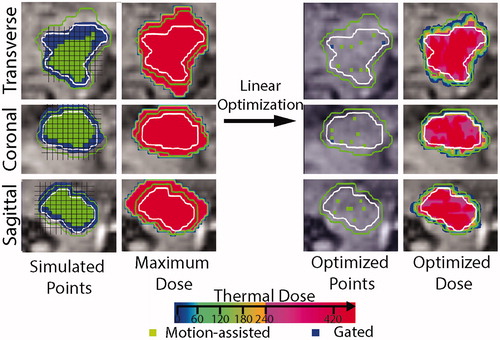
Figure 6. Comparison of delivered thermal dose and planning sonications after optimization in three scenarios respectively, motion-assisted/gated, gated and static scenario. The contour of the target in the reference phase is represented with a white contour and as an indication a margin contour at 3 mm of the target is indicated in green.
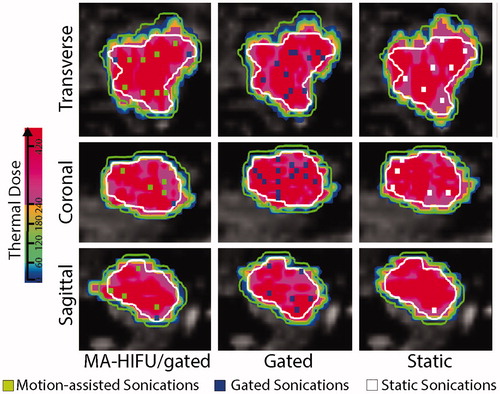
Figure 7. Optimized number of sonications to ablate the overall target in all volunteers as a function of different energy delivery strategies: gated, combined (motion-assisted/gated) and static.
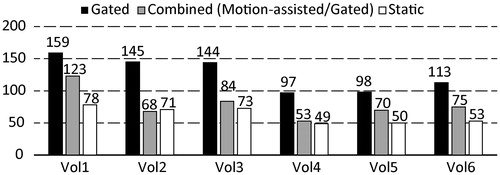
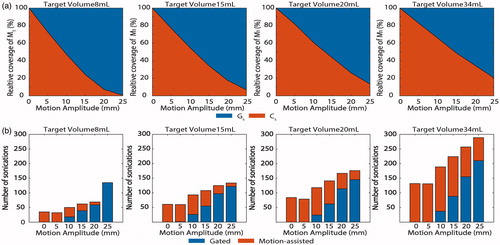
Figure 8. (a) Evolution of the continuous sonication (Cs) and gated sonication (Gs) volume as a function of the maximum motion displacement in four different tumor volumes (8, 15, 20, 34 mL). Coverage volume is expressed as a percentage coverage of the target M1. (b) Number of sonications needed to achieve 100% ablation as a function of the maximum motion displacement for the same four different tumor volumes. The number of continuous and gated sonications within the overall number of sonications is also represented.