Figures & data
Figure 1. Schematic diagram of experiment design to evaluate effectiveness of combined heat-stress (HT) and exposure to Dox of human colorectal cancer cells. See text for details.
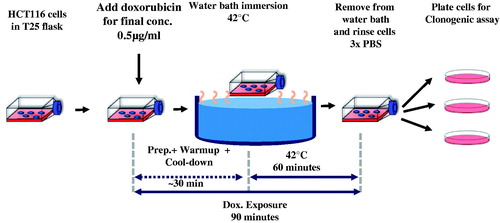
Figure 2. (a) Clonogenic survival of HCT116 (▲), HT29 (●) and CT26 (■) cells following single agent HT with escalating thermal dose (CEM43) normalized to 37 °C controls (red) and (b) clonogenic survival of HCT116 (▲), HT29 (●) and CT26 (■) cells following Dox exposure for 90 min at 37 °C normalized to negative controls. Scatter points values obtained from at least three separate experiments. For each experiment, there were three technical replicates for evaluation of clonogenic survival. (c) Univariate scatterplot showing measured clonogenic survival of HCT116 (▲), HT29 (●) and CT26 (■) cells following varied exposures to HT and Dox combinations. For each, individual data points are plotted following exposure to 60 min HT and dox for 90 min. From various sequences of heat-stress and Dox administration, simultaneous application of both modalities yielded the greatest cytotoxicity. (*p < .003, one-way ANOVA with post-hoc Tukey’s multiple comparisons test, Supplementary Figure S4). (d) Measured clonogenic survival of HCT116 cells following 90-min exposure to Dox at the indicated concentrations and at 37 °C (blue) repeated from (a). The red curve indicates clonogenic survival of HCT116 cells in a combination exposure where each data point represents a mean of several replicate experiments with fixed Dox concentration and temperature of 42 °C for a total drug-exposure time of 90 min and heat exposure time of 60 min. The green dotted lines indicate the DEF of combination exposure over Dox at 37 °C to achieve the same cytotoxicity. At IC90, the DEF is ∼12.5. The gray dotted line indicates the TER for a fixed dose of Dox. At 0.5 µg/ml, Dox the TER is ∼11. TER vs Dox concentration (µg/ml) (black dotted line) shows that TER increases gradually for Dox concentrations ≥ 0.25 µg/ml, y-axis is on the right.
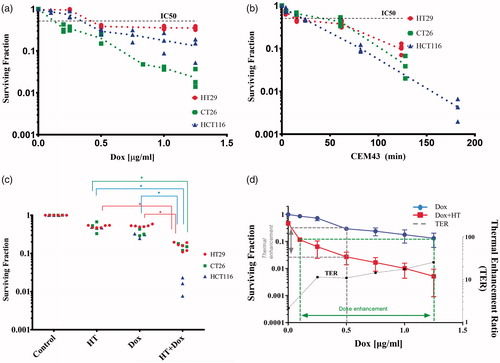
Figure 3. (a) Isobologram analysis of Dox dose escalation at 42 °C (●) and thermal dose escalation at 0.5 µg/ml Dox (▲) to determine whether combined exposure was synergistic, additive, or antagonistic. The lower left region (origin) of the IC90 line is the synergistic region and the upper right region represents antagonistic interactions. All data points that lie on the line indicate additive effects of the combination. Combined exposure to Dox and heat stress produces effects, measured by clonogenic survival, that indicate synergistic interactions. *(x,y) represent Dox dose and HT CEM43 dose used in combination treatments. Since all combinations tested lie on the origin side of the isobolograms, this indicates that these combination treatments are synergistic. (b) Interaction coefficient, ξ, vs Dox concentration for combination experiments. ξ provides a method for quantitatively comparing the level of synergy in various combination treatments. The plot shows highest synergy for simultaneous application of HT and Dox. Dox concentration was 0.5 µg/ml. Corresponding univariate scatter plot showing mean surviving fraction for various combination treatments are provided in Supplementary Figure 3.
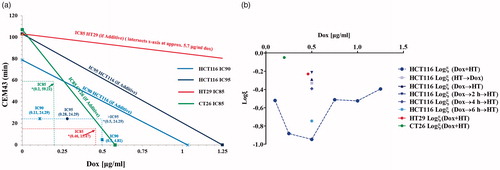
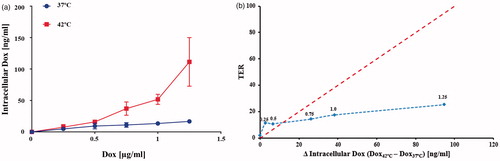
Figure 4. (a) Concentration of Dox (ng/ml) recovered from HCT116 cells using mass spectrometry for exposure to various media concentrations of Dox at 42 °C. Exposure to Dox in media having concentrations 0.75, 1 and 1.25 µg/ml. Exposure to Dox at 42 °C yielded higher recovered Dox than corresponding exposures at 37 °C (p ≤ .04 Welch’s t-test, N = 3 independent experiments). (b) TER vs change of recovered (intracellular) Dox at 42 °C relative to 37 °C shows increased in intracellular Dox did not generate a comparable increase in TER. The red dotted line is a reference drawn to indicate a hypothetical 1:1 behavior. The blue dotted line is a visual aid. Numbers above data points indicated the Dox concentration in media (µg/ml).