Figures & data
Figure 1. Research workflow. The main steps of the performed research are synthesized to highlight the crosstalk between experimental data (dark blue), mathematical modeling (light blue), and model predictions (yellow). HT: Hyperthermia.
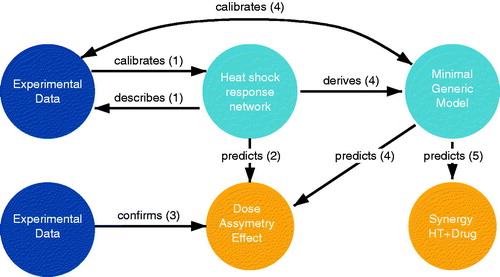
Figure 2. Survival response landscape for trapezoidal time profile. (A) Landscape of trapezoidal shapes parametrized by four parameters: maximum temperature duration τ, saturation index σ, and asymmetry index η. (B) Model-predicted survival fraction in the
plan for a 3 h exposure heat stress (τ = 3 h) trapezoidal time profile having an identical cumulative equivalent minute at 43 °C value of 180 CEM43 (
is computed accordingly). The survival fraction varies from 3.5%
to 8.1%
which corresponds to the step-up/step-down profile. The survival fraction dependency on η for the
(white line) is displayed in inset. (C) Model-predicted survival ratio, defined as the ratio of survival response between the slow–fast
and fast– slow
thermal profile, for various exposure duration τ and cumulative equivalent minute at 43 °C(CEM43) values; solid white line corresponds to
of 43 °C. The dose asymmetry effect arises for hour-long hyperthermia with Tmax >43 °C.
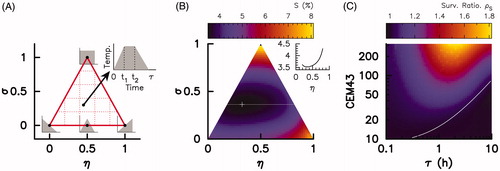
Figure 3. A predictive dynamical model of cellular viability (A) Scheme of heat-induced damage, repair and death. (B) Survival fraction in response to hyperthermia doses with rectangular time profiles of various amplitude and duration; experimental results from [Citation12] (dots), output of the dynamical model (solid lines), CEM43 description (dashed lines). A color code is used to indicate the maximum temperature which is also indicated directly on the graph. (C) Log-likelihood landscape in the free parameter plane the round circle indicates optimal parameter set used in (B). RMSE: root-mean-square error.
![Figure 3. A predictive dynamical model of cellular viability (A) Scheme of heat-induced damage, repair and death. (B) Survival fraction in response to hyperthermia doses with rectangular time profiles of various amplitude and duration; experimental results from [Citation12] (dots), output of the dynamical model (solid lines), CEM43 description (dashed lines). A color code is used to indicate the maximum temperature which is also indicated directly on the graph. (C) Log-likelihood landscape in the free parameter plane (α−β), the round circle indicates optimal parameter set used in (B). RMSE: root-mean-square error.](/cms/asset/7d1b995c-0b7f-4976-b2bd-a20a6ba28104/ihyt_a_1633478_f0003_c.jpg)
Figure 4. Temporal dose asymmetry effect of the survival response. (A) Temperature time profile experiment by cell colony in the case of 196 CEM43 fast–slow (black line) or 200 CEM43 slow–fast (orange line) protocol. (B) Relative number of attached viable cells in the colony during the recovery at 37C after a slow–fast (black dots) or a fast–slow (blue dots) thermal protocol. Cells were exposed to hyperthermia from 0 h to 3 h. (C) Cell colony growth rate normalized to the control experiment at cell culture conditions obtained in the experiment (Exp). (D) Survival fraction predicted by the dynamical model (SIM), or predicted by the CEM43 description (CEM43). In C and D, black bars correspond to the fast–slow protocol and orange bars correspond to the slow–fast protocol.
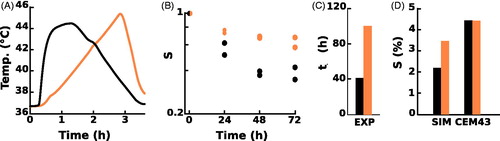
Figure 5. A minimal dynamical model captures thermal dose responses. (A) Parameter estimation based on a survival fraction induced by single rectangular-shaped hyperthermia doses of various amplitudes and durations: experimental results from [Citation12] (dots), output of the dynamical model (black lines). (B and C) are similar as and except that the predictions are computed with the reduced model 7. (C) The survival fraction varies from 5% () to 9.7%
which corresponds to the step-up/step-down profile. The survival fraction dependency on η for the
(white line) is displayed in insert.
![Figure 5. A minimal dynamical model captures thermal dose responses. (A) Parameter estimation based on a survival fraction induced by single rectangular-shaped hyperthermia doses of various amplitudes and durations: experimental results from [Citation12] (dots), output of the dynamical model (black lines). (B and C) are similar as Figure 2(B) and Figure 2(C) except that the predictions are computed with the reduced model 7. (C) The survival fraction varies from 5% ((η=0.33;σ=0.24)) to 9.7% (η=0.5;σ=1) which corresponds to the step-up/step-down profile. The survival fraction dependency on η for the σ=0.24 (white line) is displayed in insert.](/cms/asset/4e2a9fd7-e6aa-4b91-8daa-173913ecb1aa/ihyt_a_1633478_f0005_c.jpg)
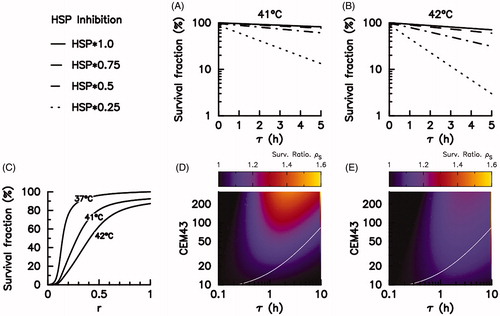
Figure 6. Inhibition of repair capacities increases the temperature sensitivity. (A,B) Model-predicted survival fraction upon the step-up/step-down hyperthermia in combination with a transient HSP inhibition of 10 h duration and various intensities: control r = 1 (solid line), r = 0.75 (dashed line), r = 0.5 (dashed-dot line), r = 0.25 (dots line). Survival fraction is computed for a fixed C (A) or
C (B) and various exposure times τ. (C) Model-predicted survival fraction as a function of the HSP inhibition level r. The exposure duration of the hyperthermia is fixed (τ = 2 h). The different solid lines correspond to different
values (37 °C, 41 °C, and 42 °C) which are indicated directly on the plot. (D,E) Model-predicted survival ratio upon a transient HSP inhibition of 10 h duration (D) r = 0.5, (E) r = 0.25. The survival ratio, defined as the ratio of survival response between the slow–fast
and fast–slow
thermal profile, is computed for various exposure duration τ and cumulative equivalent minute at 43
C (CEM43) values; solid white line corresponds to
of 43 °C.