
Figures & data
Table 1. Characteristics of patients in both treatment groups.
Figure 1. Contrast-enhanced MRI of uterine fibroids before and after microwave ablation. (A) Sagittal plane; (B) axial plane.
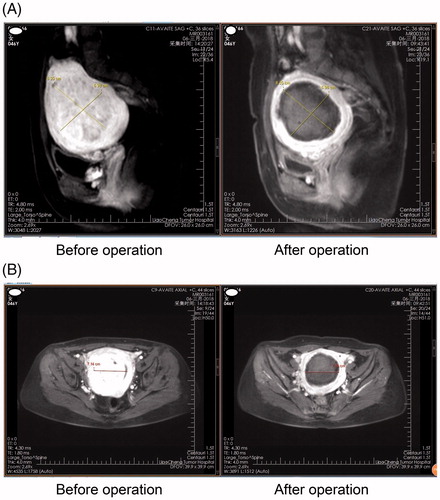
Figure 2. CDU showed hypervascular fibroids (A) before oxytocin administration (Adler grade 3); (B) after 20 min of intravenous oxytocin administration. Blood supply of myoma decreased to Adler grade 0.
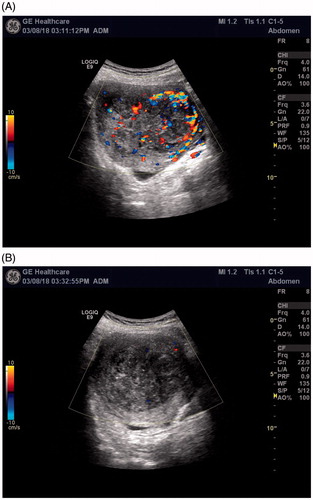
Figure 3. CEUS after quantitative ablation (50 W × 180 s). (A) Oxytocin group. (B) Control group.
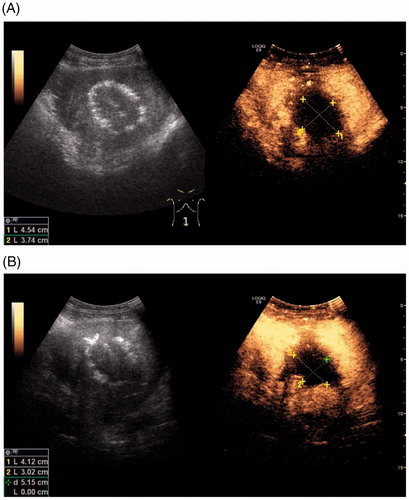
Table 2. Results of quantitative ablation (50 W × 180 s) of myoma in both groups.
Data availability statement
The datasets generated and analyzed during the present study are available from the corresponding author on reasonable request.