Figures & data
Figure 1. Intra-articular osteoblastoma of the elbow (distal humerus). Transverse T2-weighted MRI obtained during treatment: the # indicates the transducer that generates the ultrasound; the dashed arrow is the US pathway between the transducer and the lesion (dashed line) that is free from structures that could interfere with the progression of the US beam.
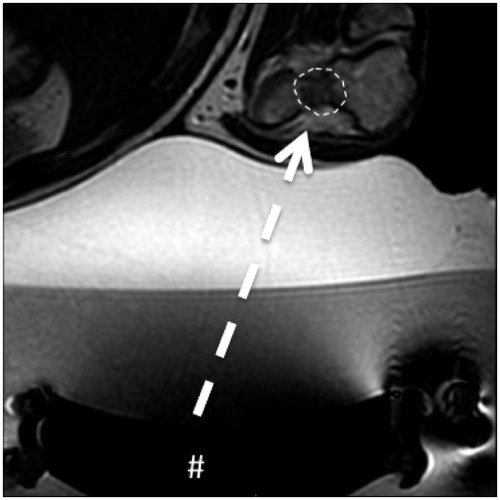
Table 1. Baseline characteristic of patient population.
Figure 2. Intra-articular osteoblatoma of the femoral neck. (a) Transverse T1-weighted fat-suppressed MRI with intra-articular administration of Gd-contrast: the lesion is indicated by the dashed line. (b) Transverse T2-weighted fat-suppressed MRI. Note the edema around the lesion (@) and the intra-articular reactive fluid (arrow) less evident that in the previous case as showed in Figure 1 and in this figure. (c) Transverse T2-weighted MRI obtained during treatment: the # indicates the transducer that generates the ultrasound; the dashed arrow is the US pathway between the transducer and the lesion (dashed line). (d) Transverse T2-weighted fat-suppressed MRI during the follow up: complete disappearance of the bone edema and of the reactive intra-articular fluid.
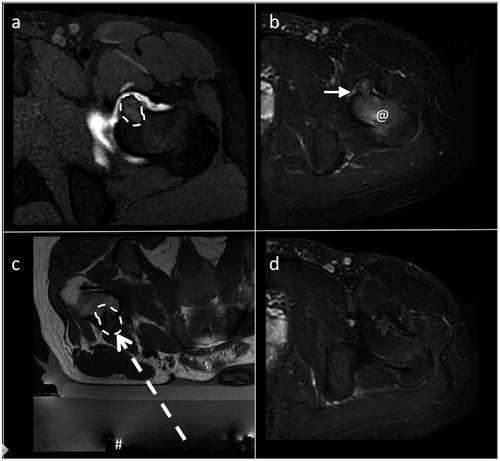
Table 2. Timing of the treatment.
Figure 3. Intra-articular osteoblastoma of the elbow (distal humerus), the same lesion of . (a) and (b) Transverse T2-weighted fat-suppressed MRI and (c) and (d) axial CT: the lesion is indicated by a dashed line in (a) and by an arrow in (c). In (b) and (d), note the disappearance of the lesion (bone healing), of the bone edema, and of the reactive intra-articular fluid.
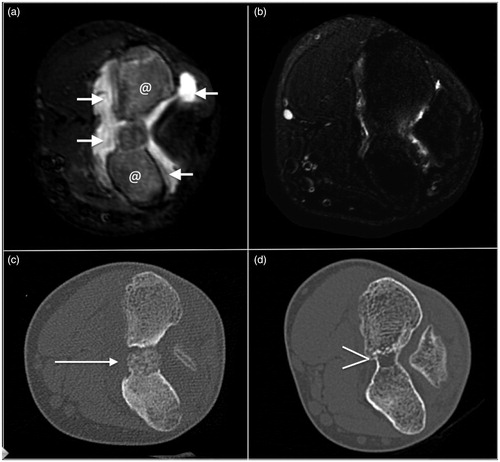
Table 3. ANOVA analysis between lesions size and treatment variable.
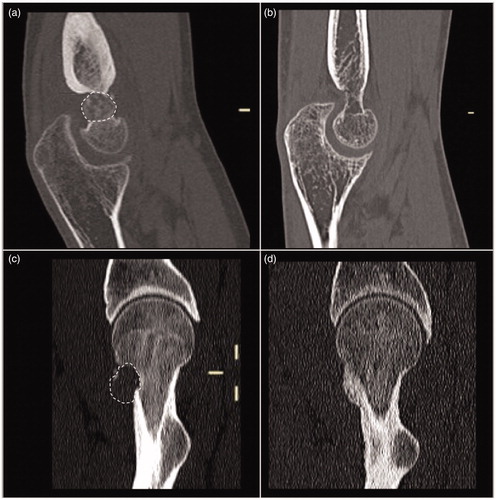
Figure 4. Sagittal reformatting of CT of the cases of the previous figures before (a) and (c) and 1 year after treatment (b) and (d). Note the complete disappearance and ossification of both the lesions with the restitutio ad integrum of the bone segments.