Figures & data
Figure 1. Cross-talk mechanisms between the environmental heat stress, energy metabolism and epigenetic modifications.
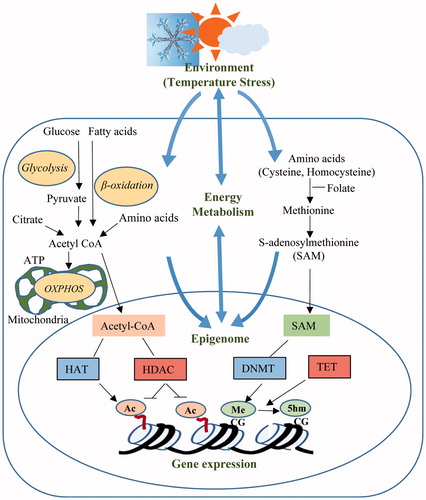
Figure 2. Average total protein content per temperature derived from C2C12 culture at different temperature for 72 h. No significant of total protein between 35 °C and 39 °C but significantly differentiated to 41 °C. All data are from three independent plates and four temperatures.
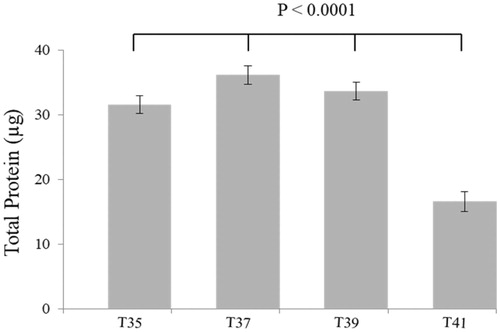
Figure 3. The temperature reduces the proliferating C2C12 myoblasts by measuring in real-time with the xCELLigence system. (A) The cell index curves represent the monitoring of living cells by impedance measurements in which the cells are exposed to different temperatures for 72 h. (B) Changes in cell index over 72 h are significantly differentiated between 35, 37 and 39 to 41 °C. The number of observations was n = 6–8 per temperature and the error bars represent least squares means and SE.
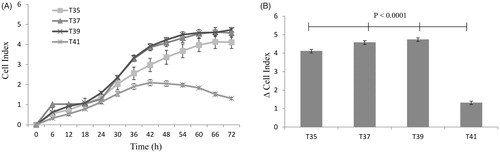
Figure 4. Metabolic flux in C2C12 cells in culture under thermal stress at 35, 37, 39 and 41 °C. The non-mitochondrial respiration, basal respiration, maximal respiration, proton leak, ATP production and spare respiratory capacity and calculated according to the Cell Mito Stress Test kit. All data are from three independent plate and four temperature and six well of 3000 cells/well per plate and per temperature (N = 72). All values (Lsmeans ± SE) are given in pmol O2/min/µg protein. *p < 0.01 versus T37 as control.
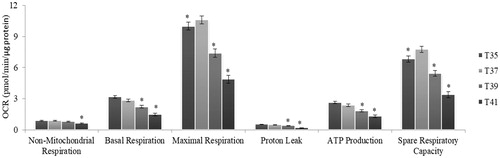
Figure 5. Metabolic flux in C2C12 cells in culture under thermal stress at 35, 37, 39 and 41 °C. The non-glycolytic, glycolytic capacity, glycolysis and glycolytic reserve were calculated according to the Glyco Stress Test kit. All data are from three independent plate and four temperature and 6 well of 3000 cell/well per plate and temperature (N = 72). Values (lsmeans ± sem) are given in mpH/min/µg protein. *p < 0.01 VS T37 as control.
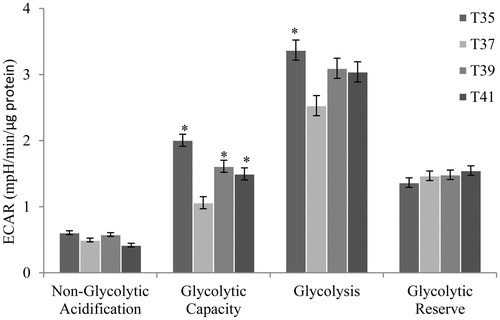
Figure 6. Global methylation in C2C12 cells in culture under thermal stress at 35, 37, 39 and 41 °C. Data presented as lsmean ± sem. A Statistical difference compared between temperature groups (p < 0.05).
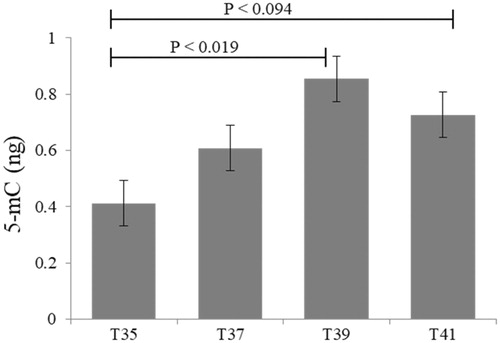
Figure 7. Global histone H4 acetylation levels in C2C12 cells in culture under thermal stress at 35, 37, 39 and 41 °C. Data presented as lsmean ± sem. A Statistical difference compared between temperature groups (p < 0.05).
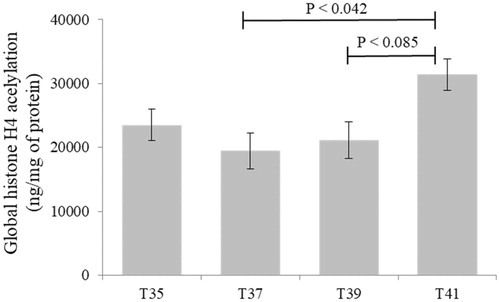
Figure 8. Expression patterns of genes encode enzymes responsible for epigenetic modifications. Statistical difference compared between control (T37) and other temperature groups (p < 0.05).
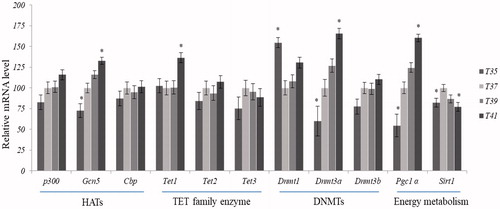
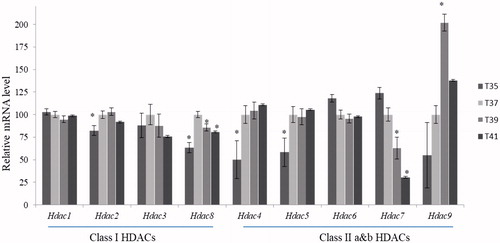
Figure 9. Expression patterns of genes encode enzymes responsible for the removal of the acetyl group from histone protein tails. Statistical difference compared between control (T37) and other temperature groups (p < 0.05).