1,716
Views
15
CrossRef citations to date
0
Altmetric
Original Articles

Intraprocedural contrast-enhanced ultrasound-CT/MR fusion imaging assessment in HCC thermal ablation to reduce local tumor progression: compared with routine contrast-enhanced ultrasound

, , , , , , & show all
Pages 784-792 | Received 20 Mar 2019, Accepted 01 Jul 2019, Published online: 20 Aug 2019

Figures & data

Figure 1. A case using CEUS-MR fusion imaging for intraprocedural treatment response assessment. (a) shows the co-registration process: a1 shows the overlapped US and MR images; the left branch of the portal vein is chosen as an anatomical landmark; a2 shows the corresponding MR image. (b) shows the first CEUS-MR fusion imaging assessment: b1 shows the overlapped CEUS and MR images after the administration of the contrast agent; AM is inadequate (arrow); b2 shows the corresponding MR image with the tumor outlined in blue and the AM in purple. (c) shows the process of supplementary ablation: c1 shows that the electrode is inserted to the site of inadequate AM (arrow) under the guidance of US-MR fusion imaging; c2 shows the corresponding MR image. (d) shows the second CEUS-MR fusion imaging assessment: d1 shows the overlapped CEUS and MR images; adequate AM is obtained (arrow) after the supplementary ablation; d2 shows the corresponding MR image.

Figure 1. A case using CEUS-MR fusion imaging for intraprocedural treatment response assessment. (a) shows the co-registration process: a1 shows the overlapped US and MR images; the left branch of the portal vein is chosen as an anatomical landmark; a2 shows the corresponding MR image. (b) shows the first CEUS-MR fusion imaging assessment: b1 shows the overlapped CEUS and MR images after the administration of the contrast agent; AM is inadequate (arrow); b2 shows the corresponding MR image with the tumor outlined in blue and the AM in purple. (c) shows the process of supplementary ablation: c1 shows that the electrode is inserted to the site of inadequate AM (arrow) under the guidance of US-MR fusion imaging; c2 shows the corresponding MR image. (d) shows the second CEUS-MR fusion imaging assessment: d1 shows the overlapped CEUS and MR images; adequate AM is obtained (arrow) after the supplementary ablation; d2 shows the corresponding MR image.

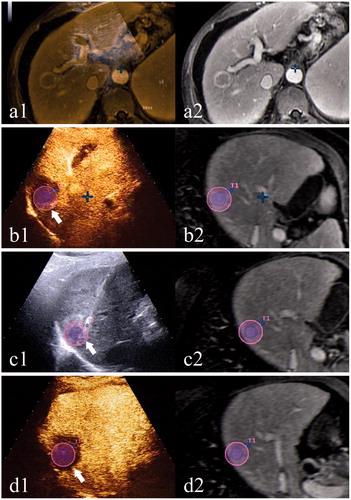
Table 1. Reasons for failure in CEUS-CT/MR fusion imaging assessment.

Table 2. Baseline characteristics of study population.

Table 3. Reasons for inadequate AM in CEUS-CT/MR fusion imaging group.

Figure 2. Cumulative local tumor progression rate curves. (a) Cumulative local tumor progression rate curves of lesions with adequate and inadequate AM in fusion imaging group. The difference was significant by the first 21 months (p = .028) but was not significant as a whole (p = .447). (b) Cumulative local tumor progression rate curves of two groups. The difference was not significant as a whole (p = .316). (c) Cumulative local tumor progression rate curves of lesions of two groups that didn’t receive TACE therapy 1–2 weeks before ablation. The difference was not significant as a whole (p = .549). (d) Cumulative local tumor progression rate curves of lesions of two groups that received TACE therapy 1–2 weeks before ablation. The difference was significant as a whole (p = .032).

Figure 2. Cumulative local tumor progression rate curves. (a) Cumulative local tumor progression rate curves of lesions with adequate and inadequate AM in fusion imaging group. The difference was significant by the first 21 months (p = .028) but was not significant as a whole (p = .447). (b) Cumulative local tumor progression rate curves of two groups. The difference was not significant as a whole (p = .316). (c) Cumulative local tumor progression rate curves of lesions of two groups that didn’t receive TACE therapy 1–2 weeks before ablation. The difference was not significant as a whole (p = .549). (d) Cumulative local tumor progression rate curves of lesions of two groups that received TACE therapy 1–2 weeks before ablation. The difference was significant as a whole (p = .032).

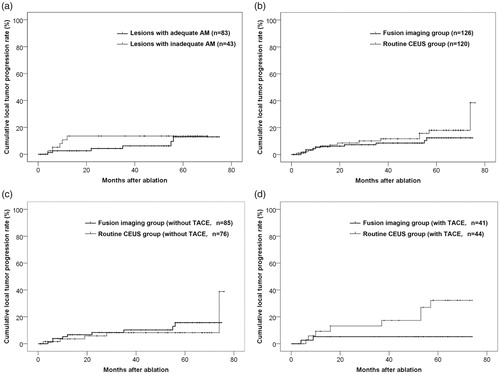
Table 4. Cumulative local tumor progression rate of each year.

Figure 3. Overall survival rate curves. (a) Overall survival rate curves of two groups. The difference was not significant as a whole (p = .892). (b) Overall survival rate curves of patients of two groups that received TACE therapy 1–2 weeks before ablation. The difference was not significant as a whole (p = .901).

Figure 3. Overall survival rate curves. (a) Overall survival rate curves of two groups. The difference was not significant as a whole (p = .892). (b) Overall survival rate curves of patients of two groups that received TACE therapy 1–2 weeks before ablation. The difference was not significant as a whole (p = .901).

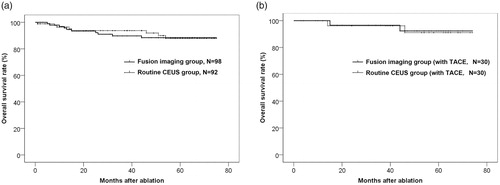
Table 5. Overall survival rate of each year.