Figures & data
Figure 1. Schematics of experimental setup. (a) A mouse carrying two tumors (blue ellipsoids) is injected with TSL–Dox (red). (b) The infused TSL-Dox is restricted to the blood vessels (red). Application of localized hyperthermia to the tumor releases Dox from TSL within the tumor vasculature. This released drug is taken up by tumor tissue, which can be visualized by fluorescence imaging. (c) The fluorescence intensity of the delivered Dox in the tumor region (pink ellipsoid) during and after hyperthermia is predictive of the tumor drug concentration.
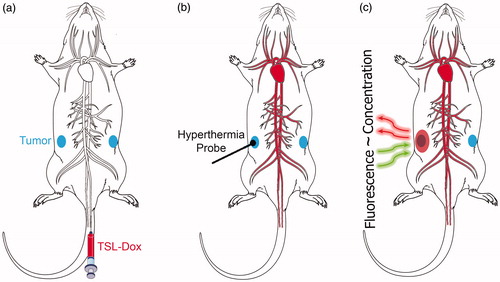
Figure 2. Temperature profile surrounding the hyperthermia probe. (a) In vitro cross sectional temperature map measured ∼20 min after hyperthermia start. (b) In vitro radial temperature profile measured from the probe tip surface (x = 0). Temperature difference (ΔT (°C)) relative to baseline temperature is shown in both figures. (c) In vivo tumor surface temperature measured 1 min after hyperthermia start. (d) In vivo surface temperature profile at different times (along dashed line in ) demonstrates steady state after ∼10 min.
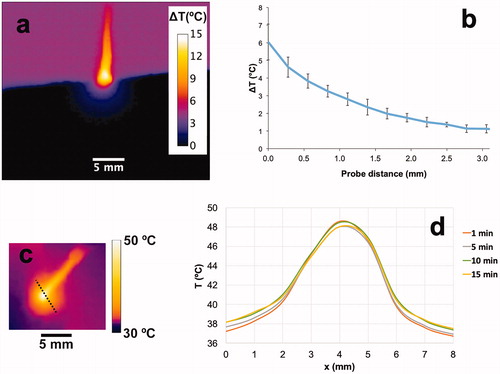
Figure 3. Uptake of doxorubicin (Dox) during hyperthermia (HT) can be visualized by fluorescence imaging. (a) Fluorescence image series of representative tumors exposed to HT for 15 min (top row), 30 min (middle row), and 60 min (bottom row) are shown. Fluorescence increases during HT and indicates the tissue region where drug delivery occurred. Fluorescence of unheated contralateral tumors did not change. (b) Mean fluorescence intensity of each tumor ROI visually not obstructed by the probe was quantified during heating. Tumor ROI fluorescence in heated tumors increased as long as HT was applied, with subsequent drop in fluorescence upon discontinuation of heating. Tumor ROI fluorescence of unheated control tumors did not increase. (c) Representative fluorescence images after HT completion and probe removal, with tumor ROI indicated as yellow outline. The tumor ROI was manually outlined as the tissue region with visual fluorescence enhancement. (d) Mean fluorescence intensity in tumor ROI for heated (HT, red bars) and unheated tumors (no HT, blue bars), after HT completion and probe removal. Tumor ROI fluorescence increased with HT duration, and all tumors in HT groups exhibited significantly higher fluorescence signals than the unheated control tumors in the same group (*p < .05).
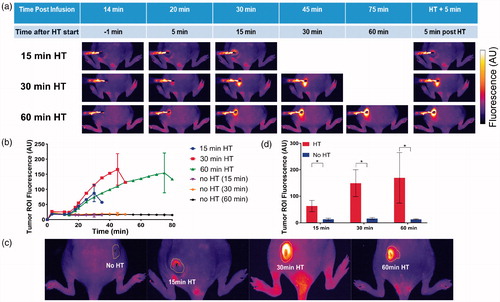
Figure 4. Tumor drug uptake increases with duration of HT. (a) At the conclusion of HT, the entire tumors were excised and fluorescence imaging was performed for both lateral and medial views. Higher fluorescence in lateral views indicated more drug was delivered in tumor regions adjacent to the HT probe. (b) Tumor Dox concentration was quantified by HPLC for tumors receiving HT (red bars), and contralateral tumors with no HT (blue bars). Tumor concentration (average of whole tumors) was significantly higher in heated vs. unheated tumors in the groups receiving either 30 or 60 min of HT. A comparison of the heated tumor concentrations between 15 and 30 min, and between 15 and 60 min HT approached significance (p = .06). A regression analysis identified HT duration as significant predictor of tumor drug uptake (p = .02).
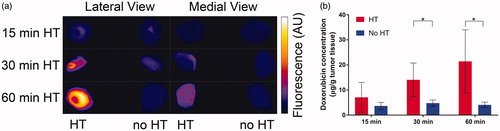
Table 1. Tissue fluorescence and concentration of (Dox) exposed to varying durations of HT.
Table 2. Statistical tests to determine effects of hyperthermia (HT).
Figure 5. Plasma pharmacokinetics. (a) Plasma concentration of Dox was measured after injection of TSL-Dox, and after completion of hyperthermia in each of the groups (15, 30 and 60 min). Plasma half-life was 56.0 ± 15.9 min. (b) Plasma concentration of Dox was measured at 6 min and 75 min after injection with animals on either 34 °C or 37 °C thermal support inside the imaging system. At 37 °C thermal support, core temperature was elevated above 39 °C, resulting in accelerated systemic leakage from TSL and a diminished plasma half-life.
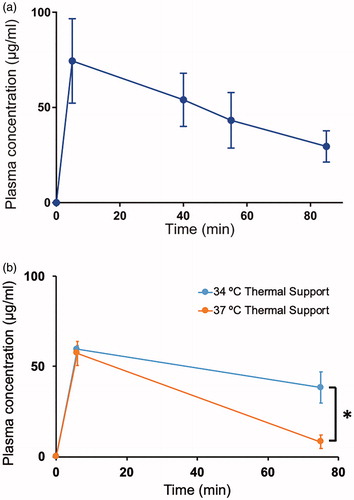
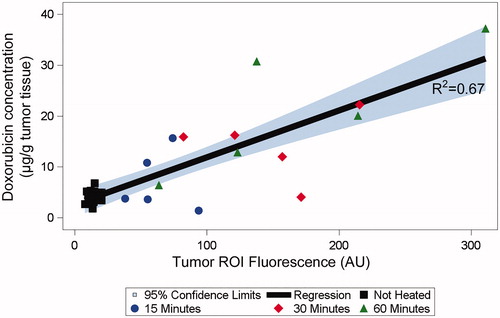
Figure 6. Fluorescence intensity predicts drug delivered to tumors. The mean fluorescence in the tumor ROI measured after hyperthermia conclusion was predictive of the concentration of doxorubicin delivered to tumors (p = .002).